COMP1004 Introduction to Artificial Intelligence and Data Analytics
📢 Disclaimer Copyright © The Hong Kong Polytechnic University, Faculty of Engineering, Department of Computing The lecture notes is for reference only, permission is hereby granted, free of charge, to any person obtaining a copy of this documentation file, to deal in the Page without restriction, including without limitation the rights to use, copy, modify, merge, publish, distribute, sublicense, and/or sell copies of the Software, and to permit persons to whom the Page is furnished to do so. The authors or copyright holders are not be liable for any claim, damages or other liabillty, whether in an action of contract, tort or otherwise, arising from, out of or in connection with or the use or other dealings in the Page.
Lecture 1: DATA ANALYTICS AND BIG DATA
Global Datasphere is a measure of all new data that is captured, created, and replicated in any given year across the globe.
- One Terabyte (TB) = 1,000 Gigabytes (GB) A single TB could hold 1,000 copies of the Encyclopedia Brittanica
- All the X rays in a large hospital
| Name | Symbol | Value |
|---|---|---|
| Kilobyte | KB | 1,000 bytes |
| Megabyte | MB | 1,000,000 bytes |
| Gigabyte | GB | 1,000,000,000 bytes |
| Terabyte | TB | 1,000,000,000,000 bytes |
| Petabyte | PB | 1,000,000,000,000,000 bytes |
| Exabyte | EB | 1,000,000,000,000,000,000 bytes |
| Zettabyte | ZB | 1,000,000,000,000,000,000,000 bytes |
| Yottabyte | YB | 1,000,000,000,000,000,000,000,000 bytes |
1.1 Four data analytic capabilities
Data: Any piece of information stored and/or processed by a computer or mobile device.
Data Analytics refers to the technologies and processes that turn raw data into insight for making decisions and facilitates drawing conclusion from data

1.1.1 Descriptive Analytics
What has happened? It is estimated that 80% of generated analytics results are descriptive in nature. Descriptive analytics are often carried out via ad hoc reporting or dashboards
Examples
- What was the sales volume over the past 12 months?
- What is the number of support calls received as categorized by severity and geographic location?

1.1.2 Diagnostic Analytics
Diagnostic analytics aim to determine the cause of a phenomenon that occurred in the past using questions that focus on the reason behind the event.
Sample questions
- Why were Q2 sales less than Q1 sales?
- Why have there been more support calls originating from the Eastern region than from the Western region?
1.1.3 Predictive Analytics
Generate future predictions based upon past events.
Sample questions
- What are the chances that a customer will default on a loan if they have missed a monthly payment?
- What will be the patient survival rate if Drug B is administered instead of Drug A?
1.1.4 Prescriptive Analytics
What should I do if “x” happens?
Prescriptive analytics provide specific (prescriptive) recommendations to the user. Various outcomes are calculated, and the best course of action for each outcome is suggested.
[Examples]
- When is the best time to trade a particular stock?
1.2 Big Data
4V of Big Data
- Volume A huge amount of data
- Velocity High speed and continuous flow of data
- Variety Different types of structured, semi structured and unstructured data coming from heterogenous sources
- Veracity Data may be inconsistent, incomplete and messy
1.3 Structured vs. Unstructured data
Structured data Data conforms to a data model or schema and is often stored in tabular form.
Unstructured data Data that does not conform to a data model or data schema is known as unstructured data. Estimated to makes up 80% of the data within any given enterprise.
Semi structured data Non tabular structure, but conform to some level of structure.

1.4 The big data processing cycle
1.4.1 Collect
Collecting the raw data such as transactions, logs, and mobile devices. Permits developers to ingest a wide variety of data.
1.4.2 Store
Requires a secure, scalable, and durable repository to store data before or after the processing tasks.
1.4.3 Process and analyze
Data is transformed from its raw state into a consumable format. Usually by means of sorting, aggregating, joining, and performing more advanced functions and algorithms. The resulting datasets are then stored for further processing or made available for consumption with business intelligence and data visualization tools.
1.4.4 Consume and visualize
Data is made available to stakeholders through self service business intelligence and data visualization tools to allow fast and easy exploration of datasets. Users might also consume the resulting data in the form of statistical predictions (in the case of predictive analytics) or recommended actions (in the case of prescriptive analytics)

1.5 Databases
Designed to store and handle transaction data (live, real time data)
Relational databases (e.g. Mysql store data in tables with fixed rows and columns)
Non relational databases (NoSQL) store data in a variety of data models (e.g. JSON)
More flexible schema (how the data is organized)

1.6 Data Warehouse
Data warehouse is a giant database storing highly structured information that is optimized for analytics
Typically store current and historical data from one or more systems and disparate data sources May not reflect the most up to date state of the data. Business analysts and data scientists can connect data warehouses to explore the data, look for insights, and generate reports for business stakeholders.
[Examples] Google BigQuery, Amazon
1.7 Extract, transform, load (ETL)
The ETL processes move data from its original source (e.g. database or other sources) to the data warehouse on a regular schedule (e.g., hourly or daily)
Extract: Extract data from homogeneous/heterogeneous Transform: Clean the data and transform the data into appropriate format Load: Insert data into the target data warehouse
1.8 Solving the big data challenges
- Scaling up (Vertical scaling) Have a supercomputer with enormous amounts of storage attached to an extremely fast network.
Scaling out (Horizontal scaling)[A BETTER WAY]Have a lot of smaller computers, each with a modest amount of storage, connected by networking.

1.9 Processing of Big Data
The challenges of Big Data cannot be handled easily by traditional storage technology, e.g. databases
Hadoop A framework that allows for storing a large amount of data and the distributed processing of large data sets across clusters of computers
MapReduce a programming paradigm that enables massive scalability across hundreds or thousands of servers in a Hadoop cluster.
Apache Spark An open source unified analytics engine for large scale data processing

2.0 Distributed File Systems
A cluster is a tightly coupled collection of servers, or nodes. A distributed file system can allow us to store large files which spread across the nodes of a cluster
E.g. Hadoop Distributed File System (HDFS).
2.1 Hadoop
Splitting large dataset
Split large dataset into smaller data blocks and stored in different nodes.
In Hadoop, each block contains 128 MB of data and replicated three times by default.
Replication Factor: The number of times Hadoop framework replicate each and every data block.

Traditional approach
Moving huge amount data to the processing unit is costly. The processing unit becomes the bottleneck.

Map Function
Instead of moving data to the processing unit, we are moving the processing unit to the data
MapReduce consists of two distinct tasks Map and Reduce. Map: process data to create key value pairs in parallel

Reduce function
MapReduce consists of two distinct tasks Map and Reduce.
Map: process data by workers based on where data is stored Reduce: Aggregate results by the “reduce workers”

Visualization
Creation and study of the visual representation of data One of the most important tools for data analytics/science.

Dashboards
Dashboard is a read only snapshot of an analysis that you can share with other users for reporting purposes.
Lecture 2: OVERVIEW OF AI AND MACHINE LEARNING
Autonomous Driving Car
Self driving vehicles or “driverless” cars
Combine sensors and software to control, navigate, and drive the vehicle.
Drivers are NOT required to take control to safely operate the vehicle.
Vehicle/Object Detection
Classify and detect the objects in the image.
Assign a class to each object and draw a bounding box around it.
Disease Detection
1. Subfields of Artificial Intelligence
AI is concerned with developing machines with the ability that are usually done by us humans with our natural intelligence
Computer Vision: Enabling computers to derive information from images and videos
Natural Language Processing (NLP): Giving computers the ability to understand text and spoken words
Speech Recognition Machine Learning Deep Learning
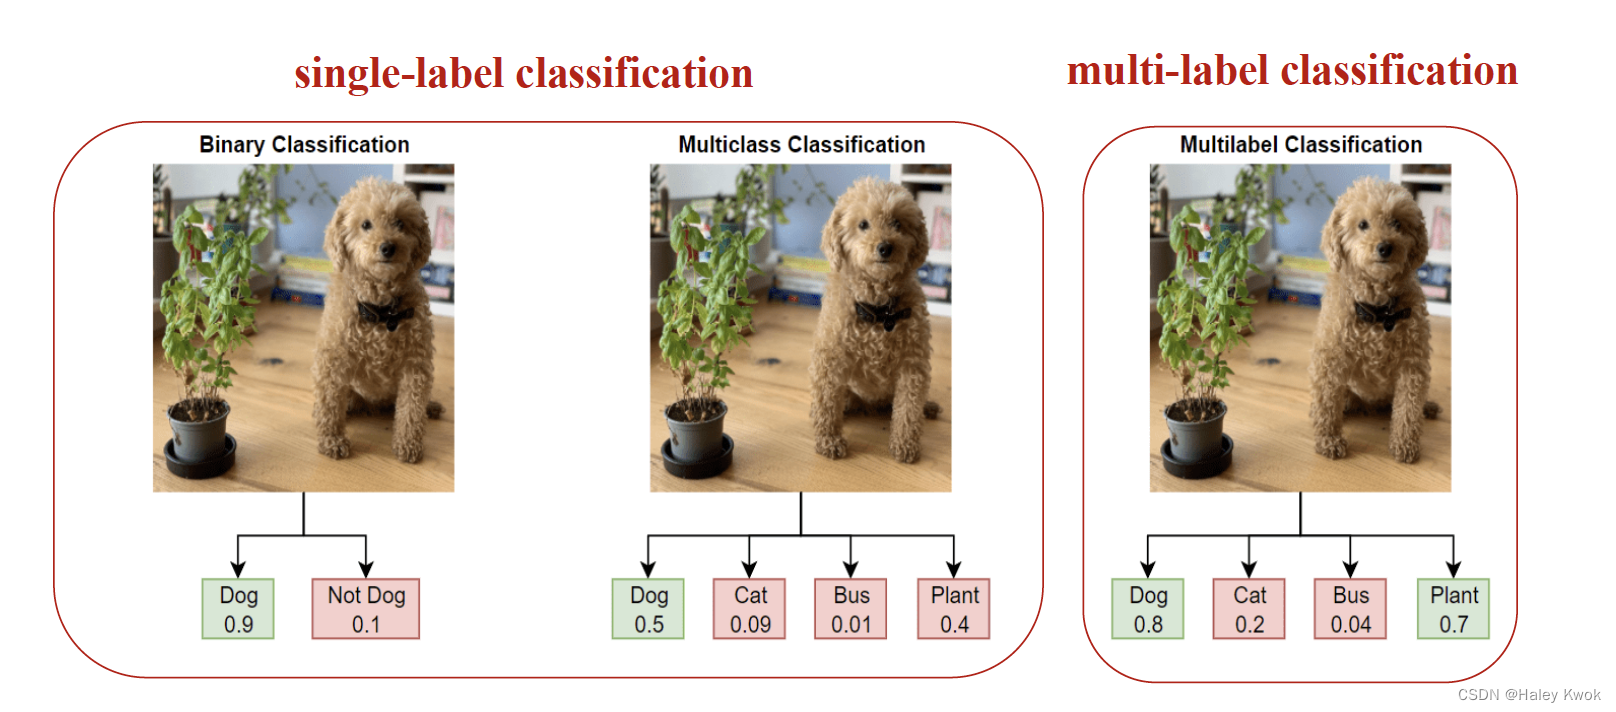
1.1 Image Classification
Image classification models take an image as input and return a prediction about which class the image belongs to.
Images are expected to have only one class for each image.
1.2 Object Detection
Takes an image as input and output the images with bounding boxes and labels on detected objects.
For example, Google Lens.
Automated Face analysis tasks
Face detection: Detect if there is a face in images/videos.
Face classification: Determine the kind of face E.g. the Age, Gender and emotion of a person from the face
Face verification: One to one Is it the same face (e.g. unlock your mobile phone)?
Face identification: One to many E.g. Police search
1.3 Natural language processing (NLP)
The branch of artificial intelligence (AI) concerned with giving computers the ability to understand text and spoken words in much the same way human beings can.
Language Translation
Sentiment analysis
Extract subjective qualities (e.g. attitude, emotion) from text.
Predict whether a movie review is positive or negative, based on the words in the movie review.
Named Entity Recognition (NER)
Identify specific entities in a text, such as dates, individuals and places

1.4 Chatbots
Software application built to simulate a human like conversation.
Involve speech recognition, natural language processing and speech synthesis
Text to speech
Text to Speech (TTS) is the task of generating natural sounding speech given text input.
May generates speech for multiple speakers and multiple languages.
Speech to text
Convert voice to text
AI, Machine Learning and Deep Learning
Example: Recognizing a digit
Let’s say that we want to teach a computer to recognize the number 7
Rules for distinguishing 7 from other characters
7s have a mostly horizontal line near the top of the figure
they have a mostly northeast southwest diagonal line
Those two lines meet in the upper right.

2. Problem: Rule-based approach
Finding a good and complete set of rules is frequently an overwhelmingly difficult task.
- The rules human experts follow are often not explicit.
- Easy to overlook exceptions and special cases.
- The technology, laws, and social conventions around human activities are constantly changing.
- Constantly monitor, update, and repair this tangled web of interconnecting rules.
Learning by examples

Provide many examples of each class of image.
The computer looks at these examples and learn about the visual appearance and features of each type of image.
Learning the rules instead of coding the rule.
3. Machine Learning
In ML, features are any property or characteristic of the data that the model can use to make predictions
Spam Classifier
Spam: junk or unwanted email, such as chain letters, promotions, etc. Ham: non spam emails.
ImageNet
A large visual database designed for use in visual object recognition software research.
More than 14 million images have been hand annotated by the project to indicate what objects are pictured, covering 100,000 classes.
ImageNet contains more than 20,000 categories.
E.g. “balloon” or “strawberry”, each consisting of several hundred images.
4. ML models and algorithms
ML Model A representation of reality using a set of rules that mimic the existing data as closely as possible
Training Giving examples to a model so it can learn. Split the dataset into two parts
Training set: Used to train the model Test set: Used to test the accuracy of the model on data the model has never seen before during training
Algorithm A procedure, or a set of steps, used to solve a problem or perform a computation The goal of machine learning algorithms is to build a model for prediction
5. K-nearest neighbor

The nearest point to this new observation is malignant and located at the coordinates (2.1, 3.6). If a point is close to another in the scatter plot, then the perimeter and concavity values are similar. We may expect that they would have the same diagnosis.
Classifying unlabelled examples by assigning them the class of similar labeled examples “k”is a parameter that specifies the number of neighbors to consider when making the classification.
Applications Recommendation systems that predict whether a person will enjoy a movie or song Identifying patterns in genetic data to detect specific proteins or diseases Computer vision applications, including optical character recognition and facial recognition in both still images and video.
3-nearest neighbor
To improve the prediction we can consider several neighboring points Among those 3 closest points, we use the majority class as our prediction for the new observation
Euclidian Distance
Euclidean distance is the distance between two points in Euclidean space. $$ d(a,b) = \sqrt{(a_1-b_1)^2 + (a_2-b_2)^2 + … + (a_n-b_n)^2}\ $$ $a = (a_1, a_2, …, a_n)\ b = (b_1, b_2, …, b_n)$ where $p$ and $q$ are two points in Euclidean space.

$$ Distance = \sqrt{(3-1)^2 + (4-2)^2 + (5-3)^2} = \sqrt{12} = 3.46 $$
Boundary method
Accuracy = # of correct predictions / # of total predictions

Find a line or curve (decision boundary) that best separates the two classes/labels of the data points • all the samples with one label are on one side of the line/curve • all those with the other label are on the other side.
Hand-writing digit recognition
MNIST handwritten digit database
Ground Truth
Ground truth is information that is known to be real or true.
Training and Loss

Epoch
The number of epochs is a hyperparameter that defines the number of times that the learning algorithm will work through the entire training dataset.
In each epoch, each sample in the training dataset has had an opportunity to update the internal model parameters. • In the first epoch, AI may make large prediction errors • Feed the training data to AI multiple times to learn from the mistakes and reduce the prediction errors
Batch size
Due to computational and memory limits, we generally don’t feed the entire training set to the AI model • Break down the training data into smaller batches which are fed to the model individually • The batch size is a hyperparameter that defines the number of samples to work through before

Hyper-parameters
Any quantity that the model creates or modifies during the training process is a parameter • We can twist many other knobs before training a model • E.g. the number of epochs, batch size, the “k” value in k nearest neighbor, learning rate (more about it later), etc • Any quantity that you set before the training process is a hyperparameter
Overfitting
The word overfitting refers to a model that models the training data well but it fails to generalize.

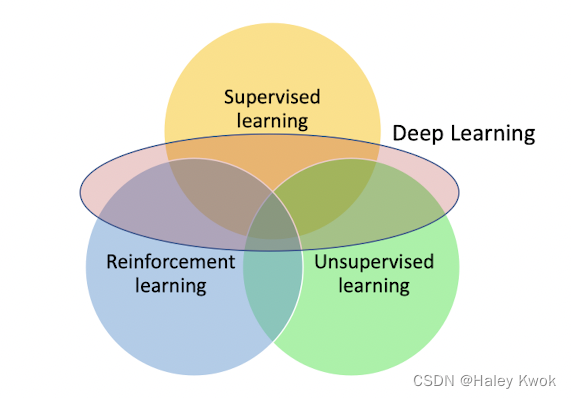
6. Types of Machine Learning
Supervised Learning
Classification (Binary/Multiclass)
Use attributes $(𝑥1,𝑥2,….)$ to predict a categorical variable $(𝑦)$ yes/no, rain/no rain
Evaluation of Model
To know how well our classifier will perform on real-world data (with new and unseen data) before we deploy it.
Positive vs. Negative Class
| Item | Meaning |
|---|---|
| True Positive (TP) | Correctly Classified as the class of interest |
| True Negative (TN) | Correctly Classified as not the class of interest |
| False Positive (FP) | Incorrectly Classified as the class of interest |
| False Negative (FN) | Incorrectly Classified as not the class of interest |
Confusion Matrix
A confusion matrix is a table that categorizes predictions according to whether they match the actual value.

Validation Set
To validate which model to use: Cross Validation
In the case of small data sets (say, less than 1,000 observations), a very popular scheme is cross-validation • The data is split into K folds (e.g., 5). A model is trained on K − 1 training folds and tested on the remaining validation fold. • This is repeated for all possible validation folds resulting in K performance estimates that can then be averaged
To make this estimate, we split the input data into three sets (e.g. 60/20/20) • Training set: for training all our models • Validation set: for making decisions on which model to use • Testing set: The selected model is finally evaluated on the test set to check how well our model did

Regression
$$y = f(x_1, x_2, x_3, …) $$
Use attributes $(𝑥1,𝑥2,….)$ to predict a numerical variable $(𝑦)$.
The output of a regression model is a number, e.g. prices, sizes, or weights.

[Examples]
Unsupervised Learning
Unsupervised learning is also a common type of machine learning. Extract information from a dataset that has no labels, or targets to predict.
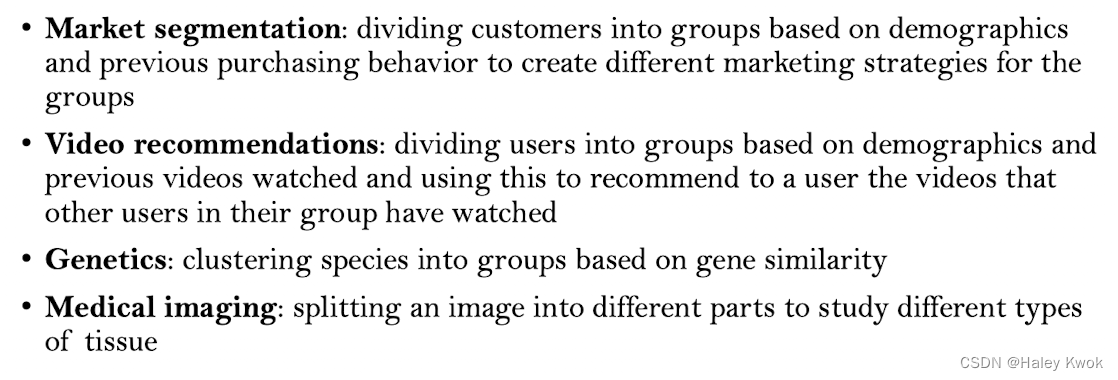
• Clustering algorithms • Group data into clusters based on similarity • Example algorithm: K-means
• Dimensionality reduction algorithms • Simplify our data and faithfully describe it with fewer features • Example algorithm: Principal component analysis (PCA)
• Association rule mining • Generative algorithms • generate new data points that resemble the existing data
Examples
Reinforcement Learning
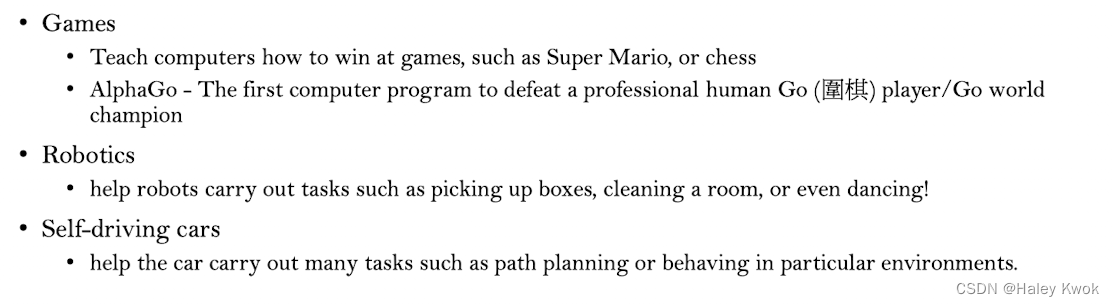
Unlike supervised learning, no labelled data is given • Reinforcement learning (RL) aim to build a history of experiences for the AI and learn through trial and error. • An agent attempts various allowed actions in an environment over multiple cycles, observes the outcome of those actions based on the environment state • The agent is learnt to perform the desired task by taking actions with good outcomes and avoiding actions with bad outcomes.
Examples
Lecture 3: REGRESSION
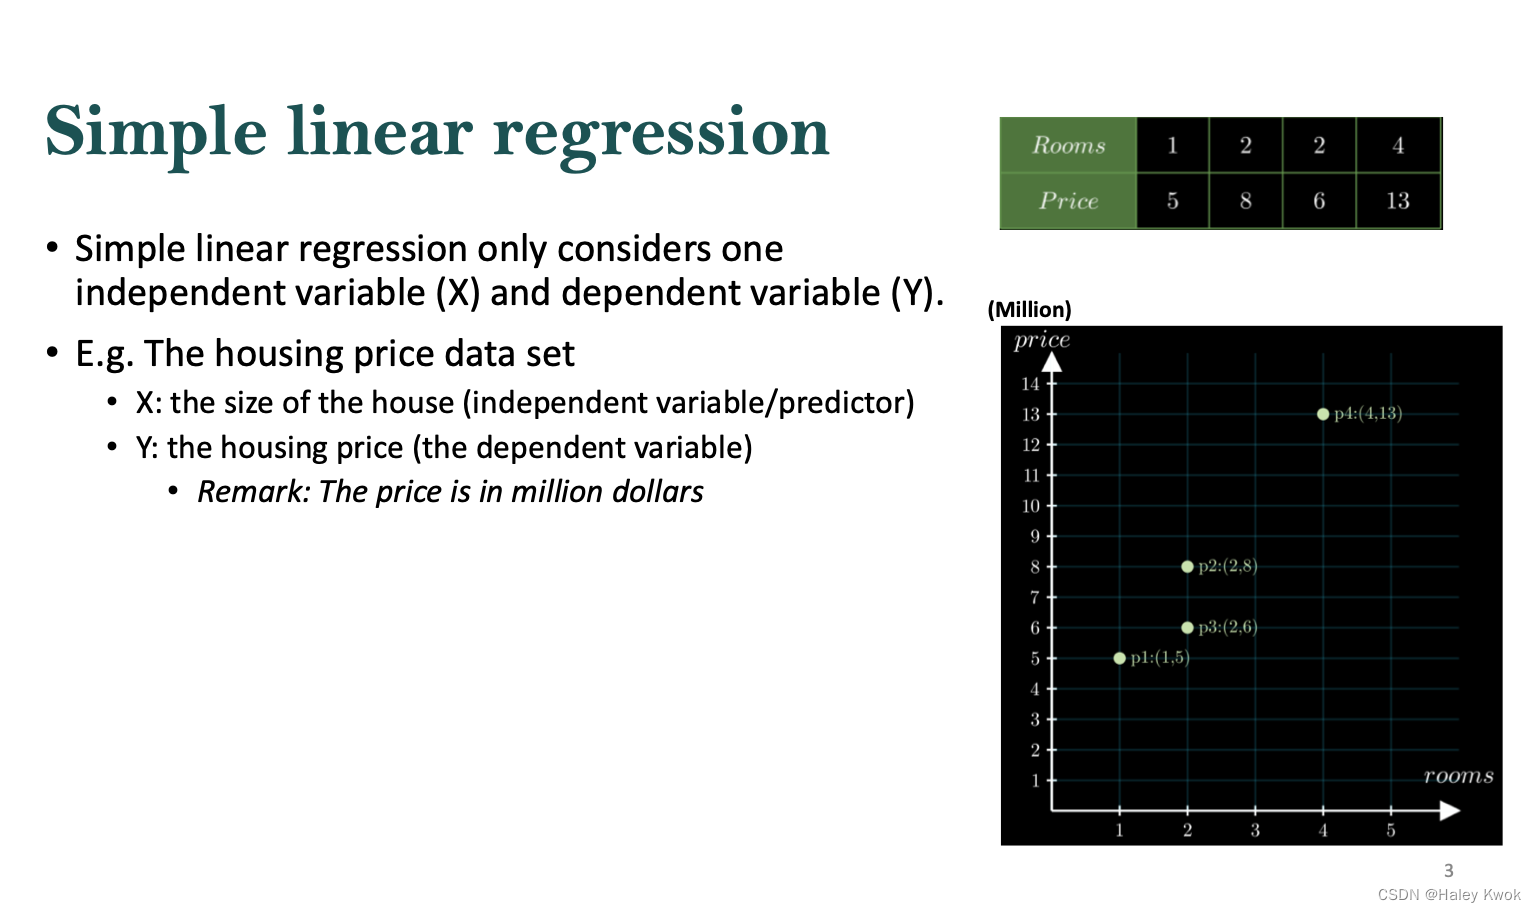
Simple Linear Regression
Finding the Model
Simple linear regression only considers one independent variable (X) and dependent variable (Y).
$$ Y = b + mX $$
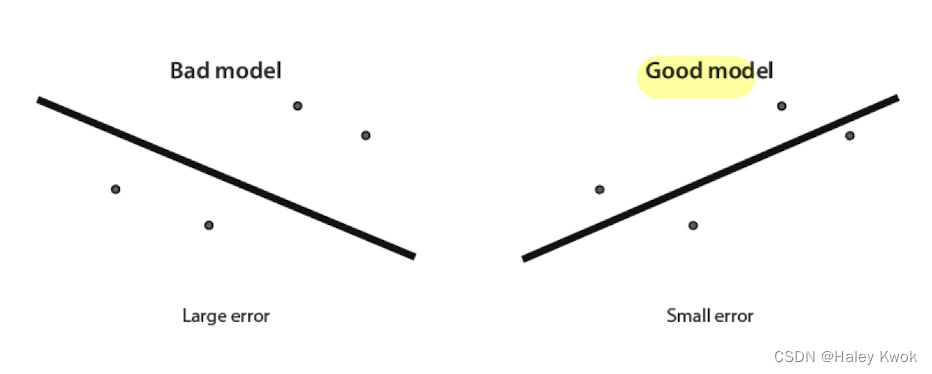
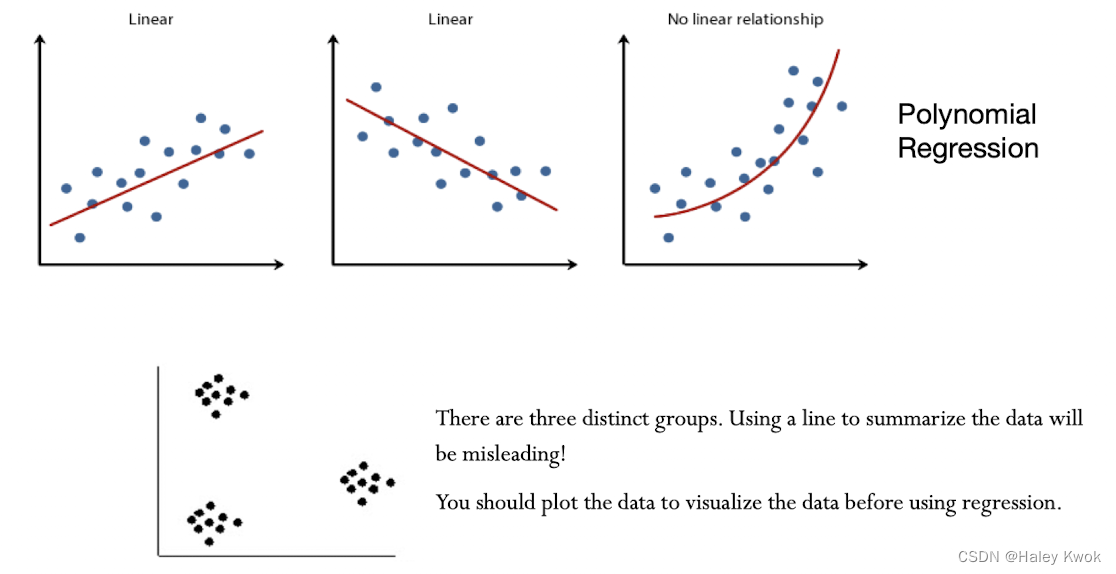
A good linear regression model is one where the line is close to the points.
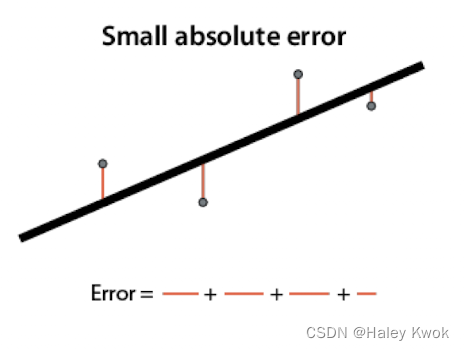
Residuals
$$ 𝑒_𝑖 = 𝑦_𝑖 −(𝒎𝑥𝑖+𝒃) $$
Absolute Error: A metric that tells us how good our model is by adding distances between predicted and actual values of the dependent variable
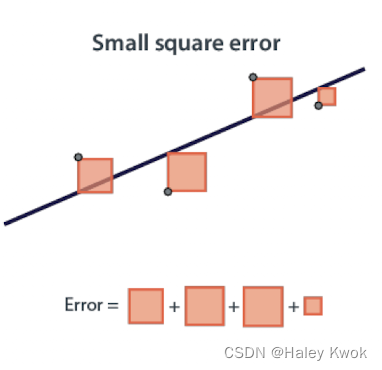
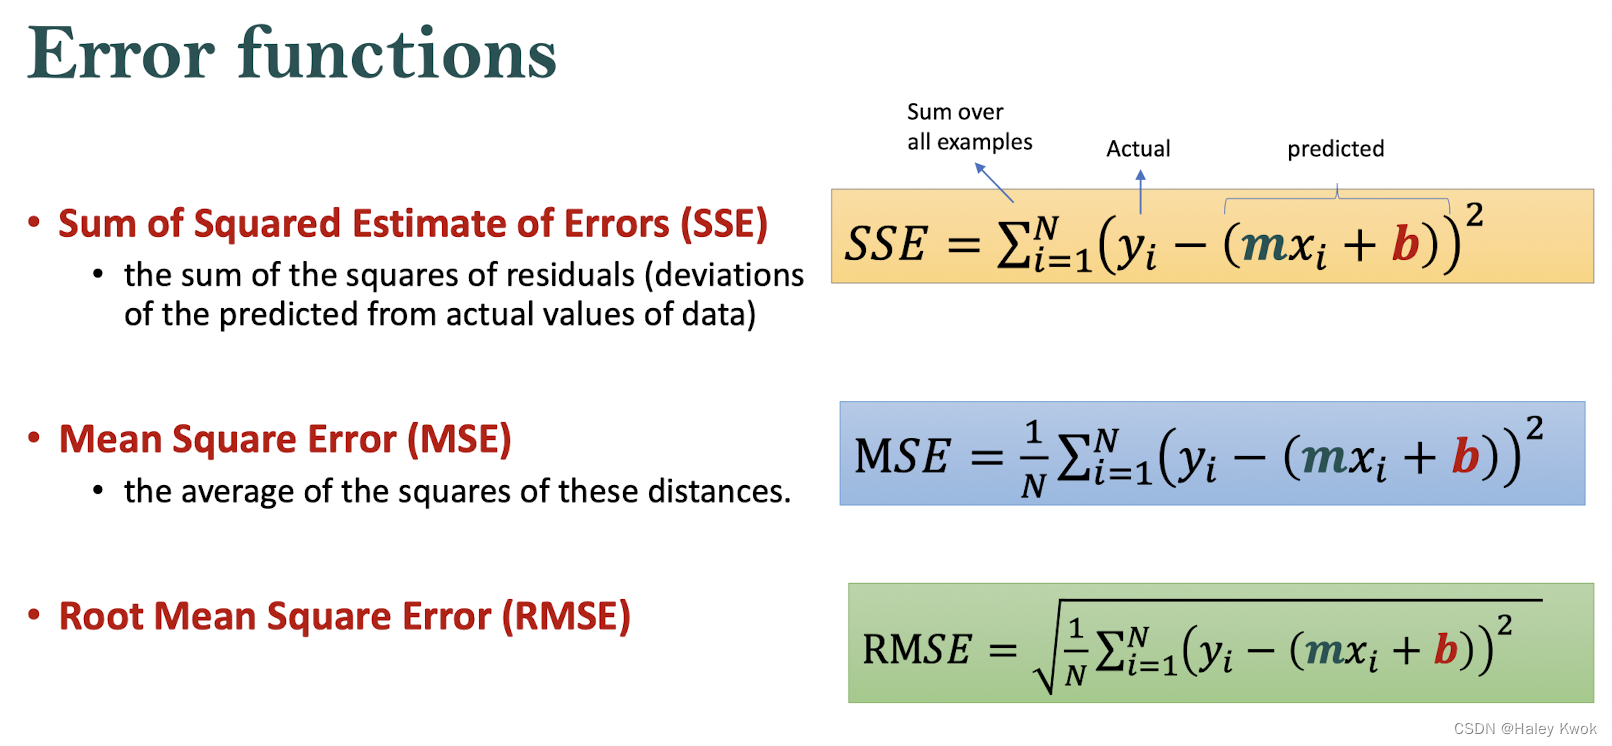
Square Error: The square error is a metric that tells us how good our model is by adding squares of residuals
Loss function
Tangent Line
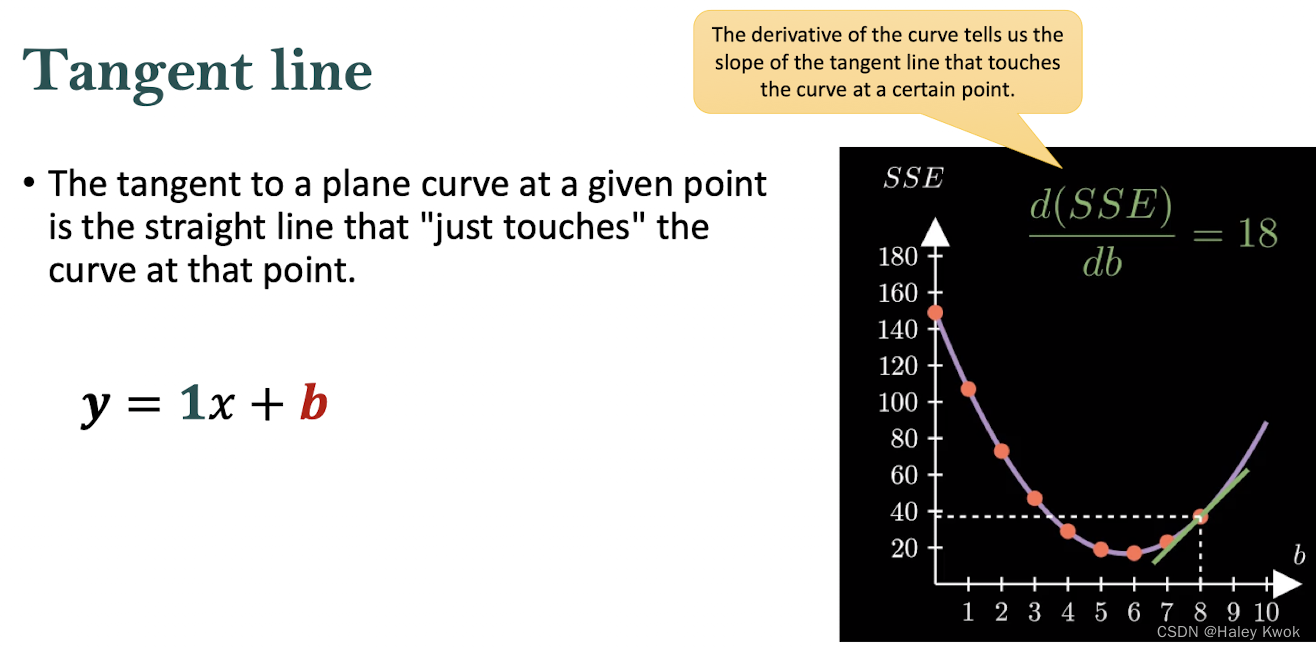
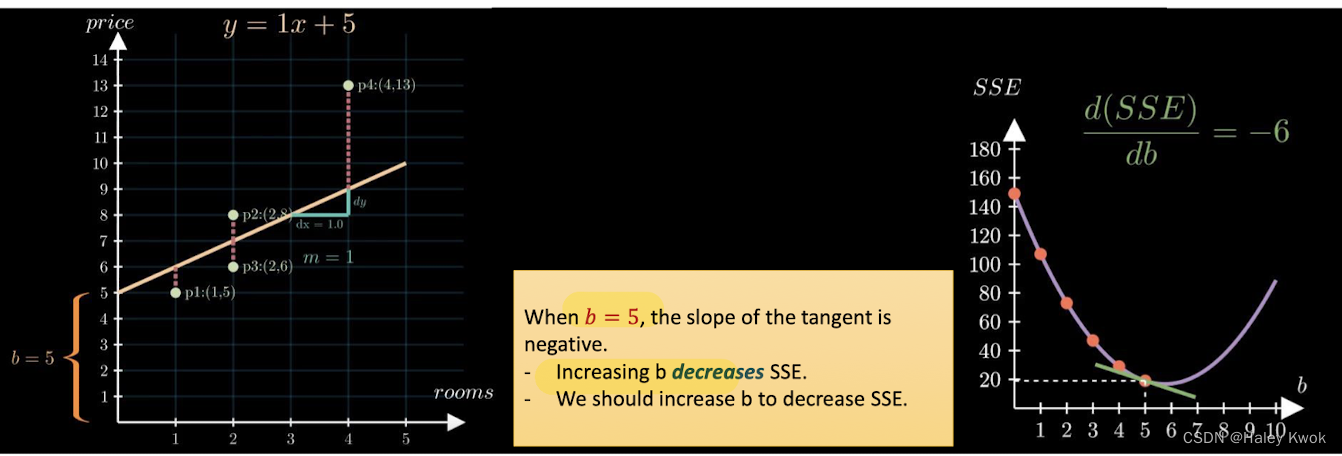
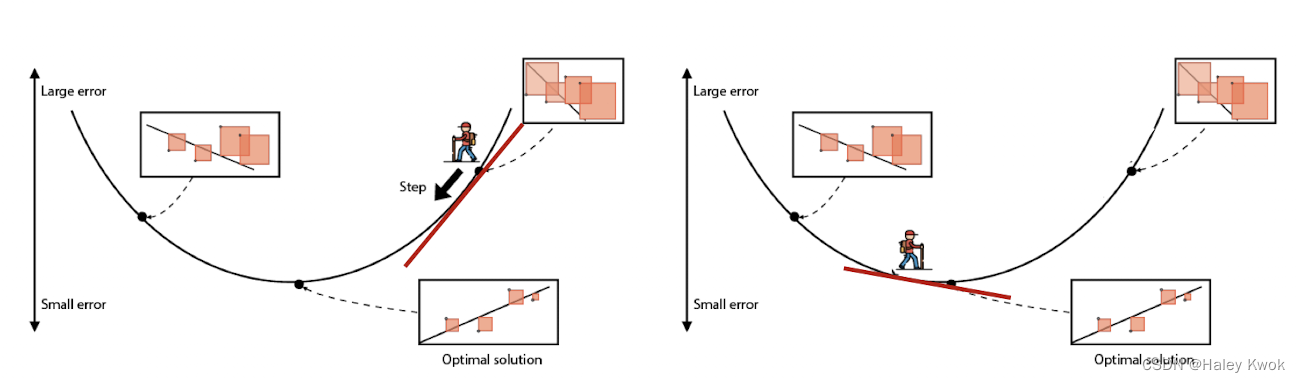
Optimization: Gradient Descent
A positive slope tells us that we should take a step to the left to get to the lowest SSE A negative slope tells us that we should take a step to the right to get to the lowest SSE
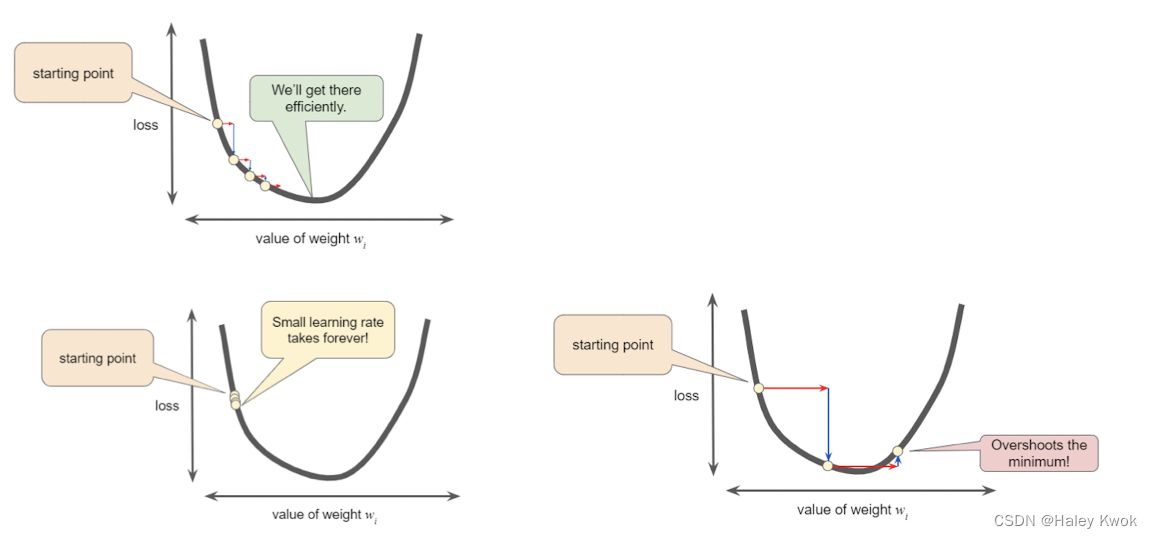
Learning Rate:
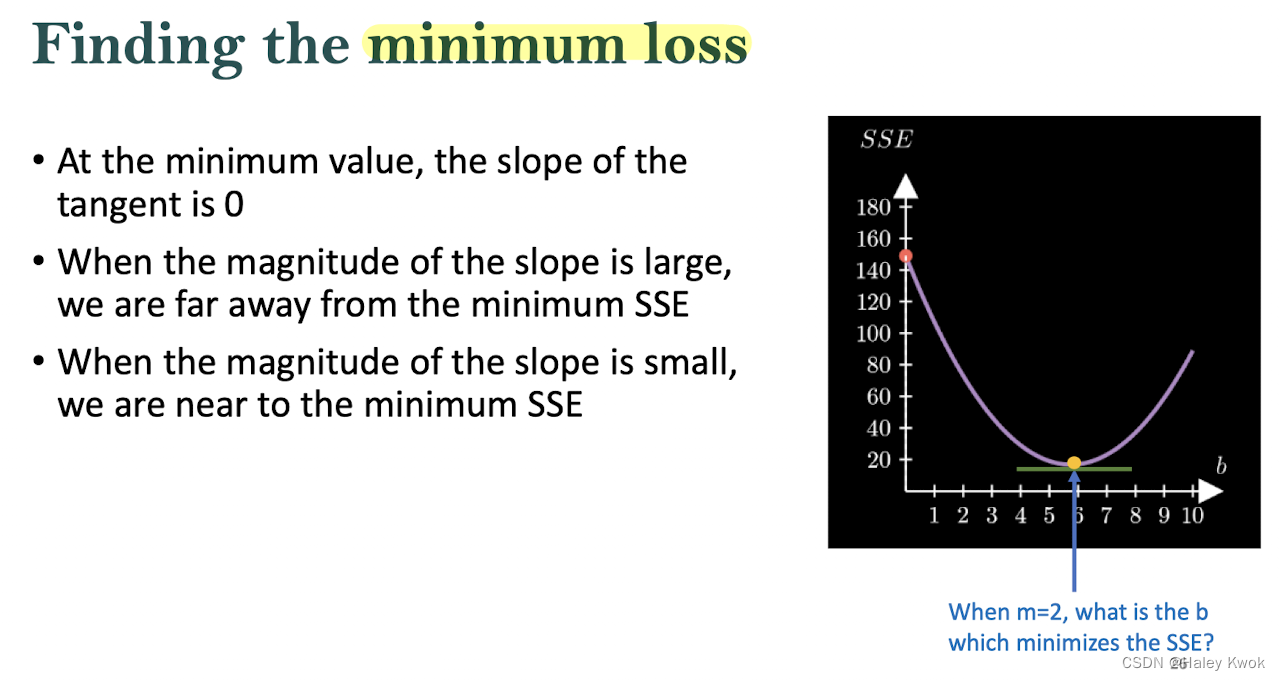
To find the local minima
Multiple Regression
Polynomial Regression
Lecture 4: CLASSIFICATION
Logistic Regression
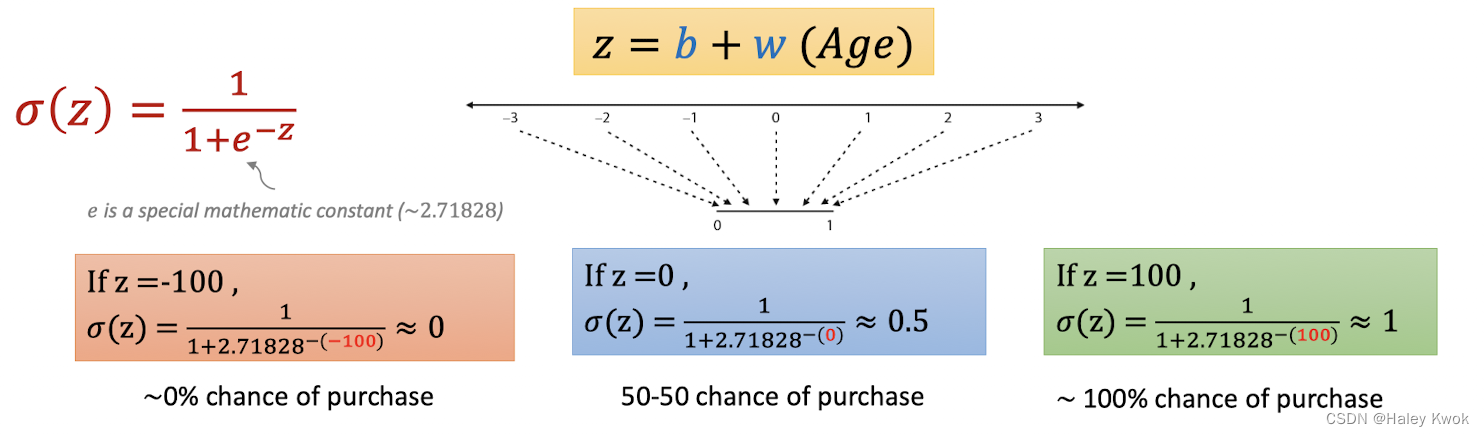
Logistic Function:
$$ f(x) = 1 / (1+e^{-x})$$
Decision Boundary
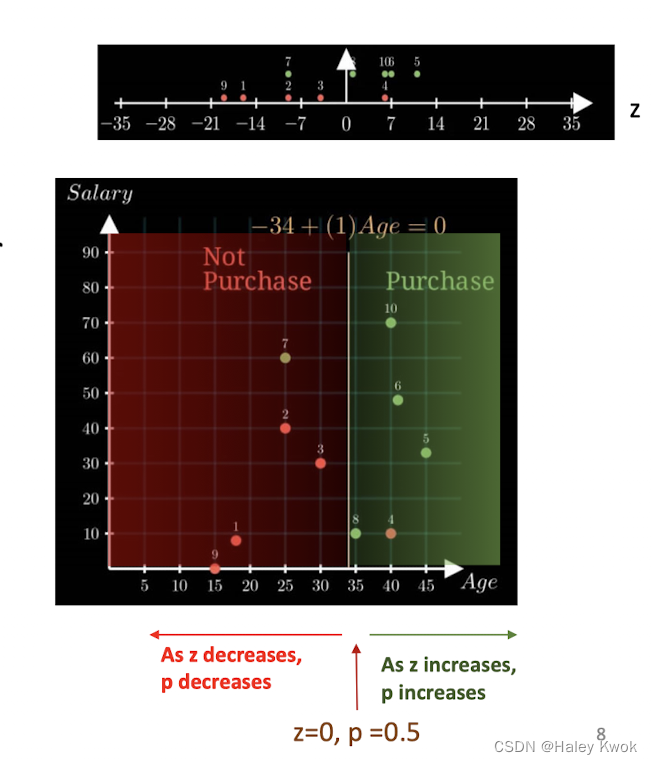
Probability
$z from {\infin}to-{\infin}$
Lecture 5: DEEP LEARNING
Artificial Neural Network (ANN) Inspired by the structure of the human brain, with a network of many cells called “neurons”.
Perceptron
A single-layer perception is the basic unit of a neural network A binary classifier which can decide whether or not an input below class Activation: the output of the neuron Activation function: calculates the artificial neuron’s output
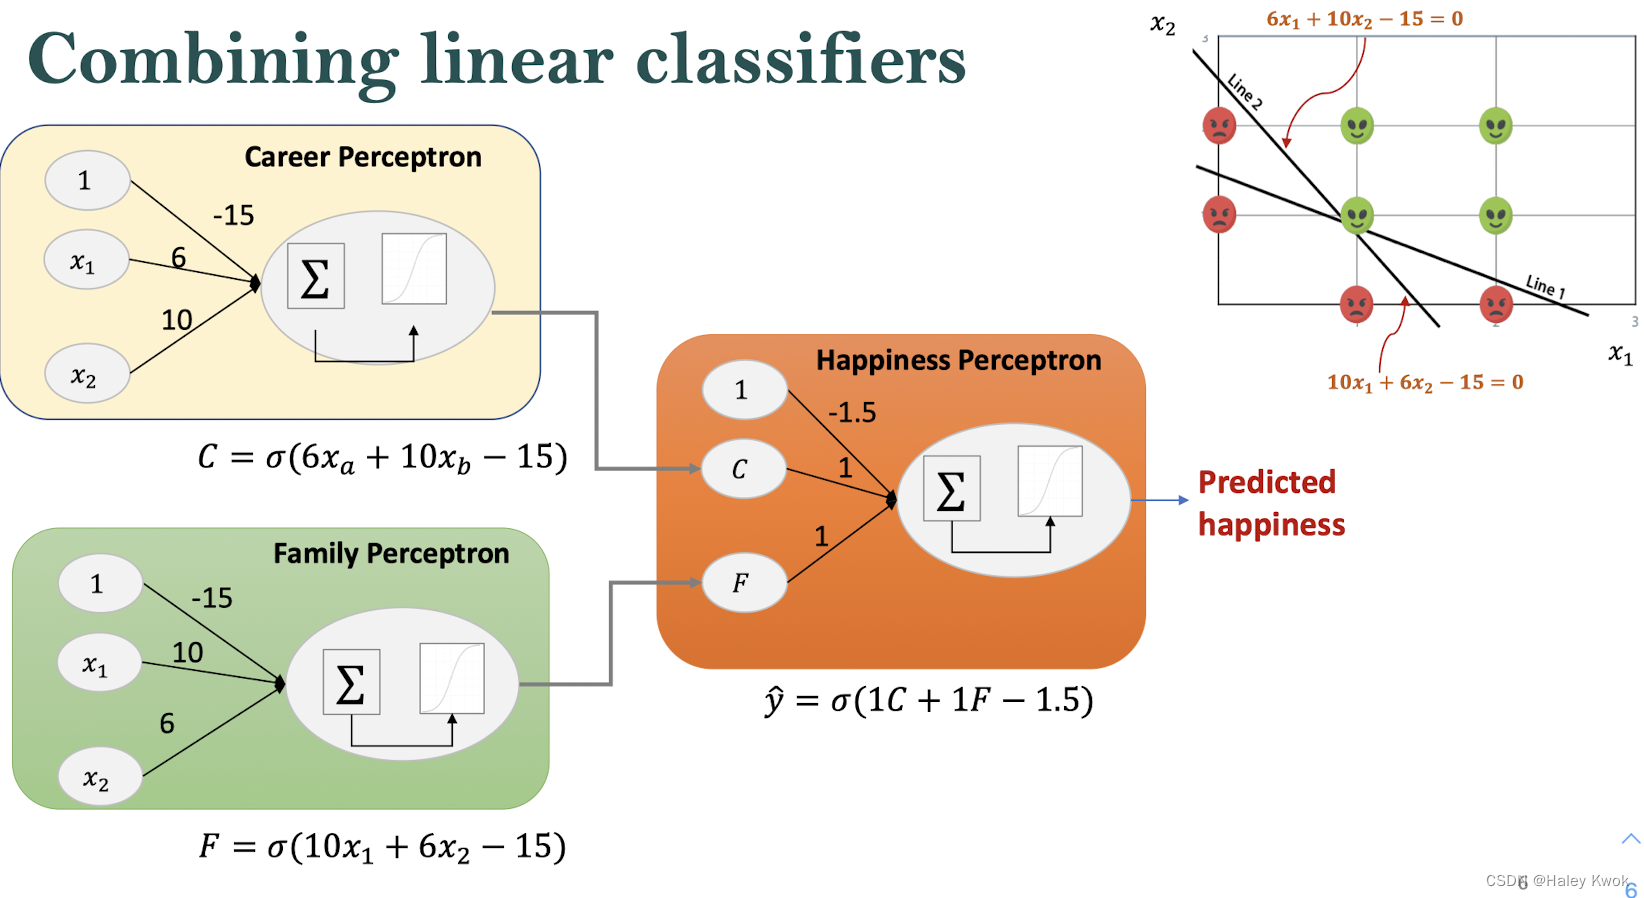
Sometimes we won’t be able to fit a linear classifier to this data, we use two lines by combining linear classifiers this way, is the basis for neural networks.
The arrangement of nodes and layers: the architecture of the neural network
Input Layers -> Hidden Layers -> Output Layers
The depth of the neural network: the number of layers (excluding the input layer)
The input layer is not counted as layer A neural network with depth of 3 • An input layer of size 4 • A hidden layer of size 3 (first hidden layer is formed by linear classifiers ) • A hidden layer of size 2 (classifiers in each successive layer are slightly more complex than those in the previous ones) • An output layer of size 3
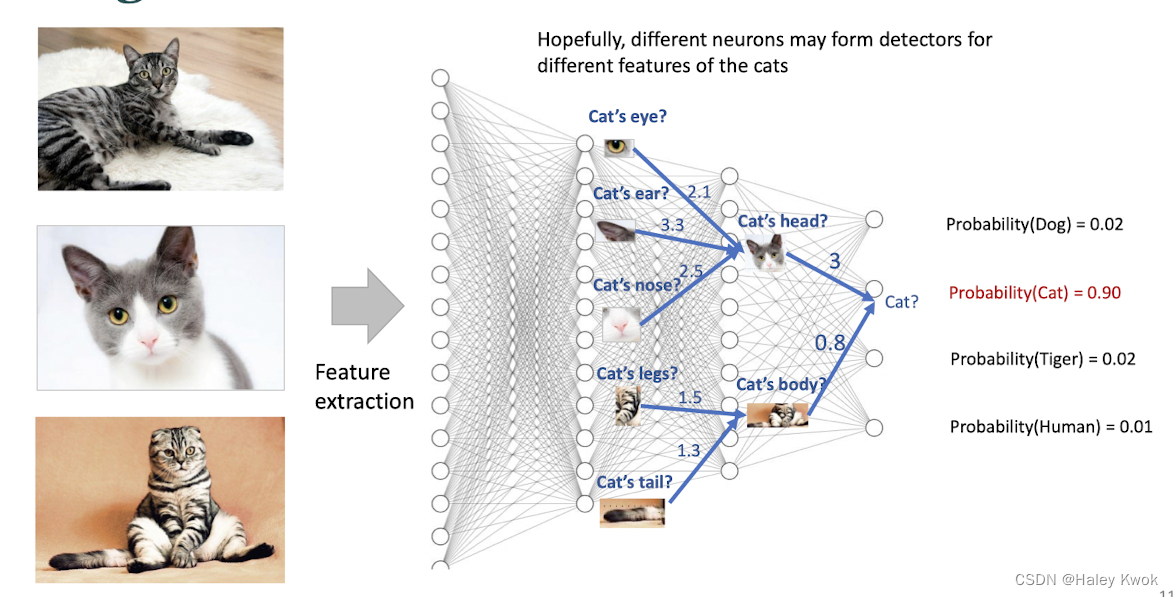
• To build a neural network, we use the outputs of two perceptrons and a bias node (represented by a classifier that always outputs a value of 1) to a third perceptron.
• The boundary of the resulting classifier is a combination of the boundaries of the input classifiers.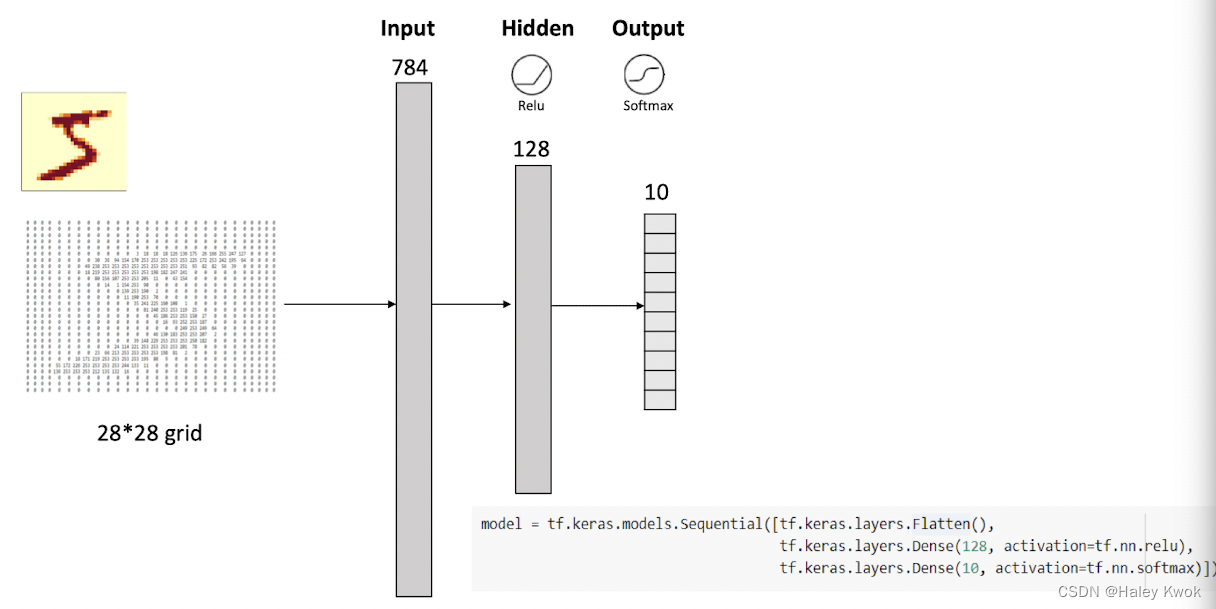
Activation functions
• An activation function takes a real number as input and returns a new floating-point number as output • We can apply a different activation function to every neuron in our network • In practice, we usually assign the same activation function to all the neurons in each layer.
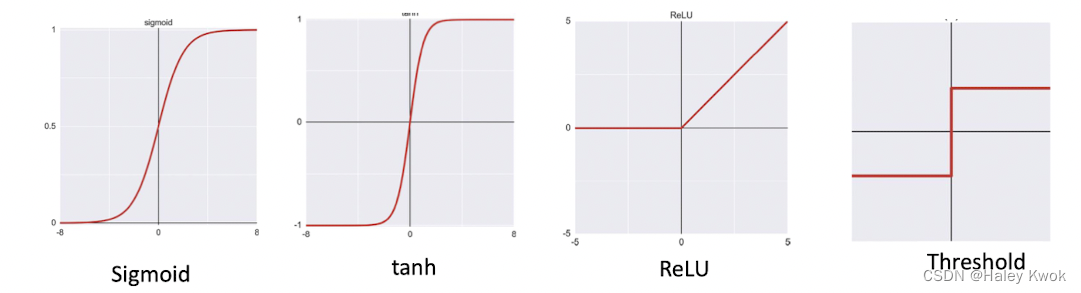
Regression - Linear Activation Function (for the amount, it is numeric, regression need no activation function)
Binary Classification—Sigmoid/Logistic Activation Function
Multiclass Classification—Softmax
Multilabel Classification—Sigmoid
The activation function used in hidden layers is typically chosen based on the type of neural network architecture. Convolutional Neural Network (CNN): ReLU activation function. Recurrent Neural Network: Tanh and/or Sigmoid activation function.
SoftMax
•turn the raw numbers that come out of a classification network into class probabilities
Neural network for regression
No activiation function is needed
Remove the final sigmoid function from the neural network
• The role of this function is to turn the input into a number between 0 and 1
• If we remove it, the neural network will be able to return any number.
Local minima
Backpropagation: How the ANN “learns”?
Remove the final sigmoid function from the neural network • The role of this function is to turn the input into a number between 0 and 1 • If we remove it, the neural network will be able to return any number.
In each epoch, update the weights and bias using gradient descent
• Forward Propagation: Take the data point one by one and perform a forward pass to calculate the prediction
• Backward Propagation: Based on the answer and the prediction error, compute how much we should adjust each weights and biases best in order decrease the errors
Deep Learning
Shallow learning algorithms are ML algorithms that do not gain in accuracy beyond a certain amount of training data. Results get better with more data + bigger models + more computation
CNN
• CNN is a neural network which utilizes a special type of layer (convolutional layers) to learn from image and image-like data. • A convolution is a filter that passes over an image, processes it, and extracts the important features (and blur the inessential features). • Excels at handling image/image-like data and computer vision tasks
LeNet
LeNet-5 was one of the earliest convolutional neural networks and promoted the development of deep learning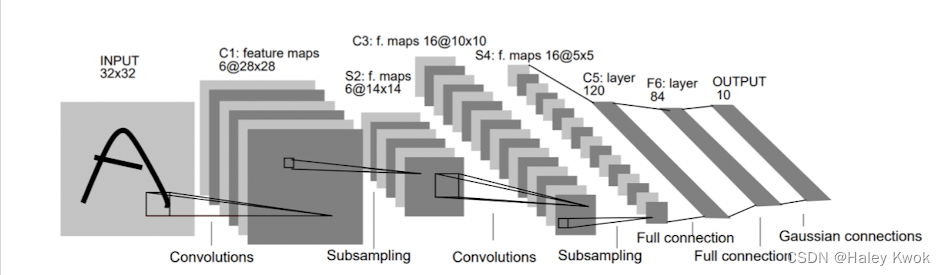
ResNet
ResNet is one of the most powerful CNN winning the ImageNet challenge in 2015
Example
- Create images that look like photographs of human faces, even though the faces don’t belong to any real person.
- Deep Fake
The use of artificial intelligence (AI) to create a fake event • in photo, video, or audio format

Cartoon GAN

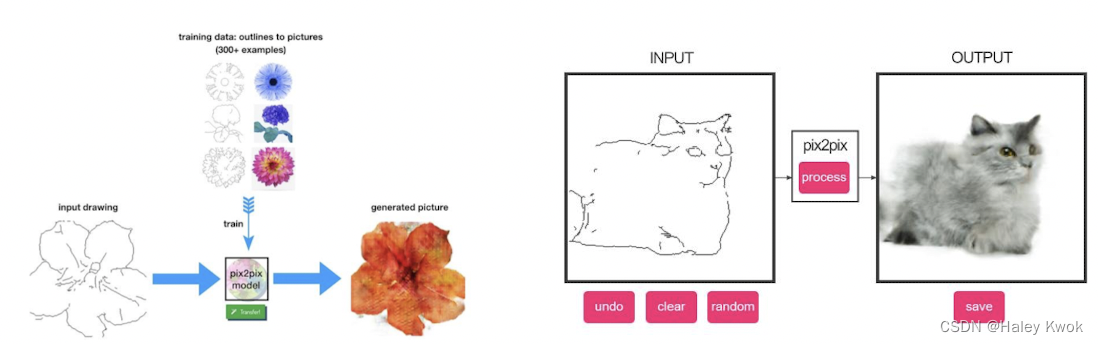
Pix2pix
Training on pairs of images and then attempts to generate the corresponding output image from any input image you give it
- ClothingGAN
- GPT-3 The prompt is text that you input to the model, and the model will respond with a text completion that attempts to match whatever context or pattern you give it.
- Dalle-2 DALL·E 2 is a new AI system that can create realistic images and art from a description in natural language.
(Deep) Reinforcement Learning
Build a history of experiences for the AI and learn through trial and error.
- Agent: The component that makes the decision of what action to take
- State: A representation of the current environment that the agent is in or the information related to the task at hand E.g. the velocities of the robot arm, location of the objects to be picked up, observations that the agent can perceive
- Action space: A set of actions the agent can choose from. • The agent influences the environment through these actions • The environment may change states as a response to the agent’s action and may also provide a reward signal as a response.
- Reward: Feedback from the environment (Positive or negative) • The agent learns from trial and error, initially taking random actions and over time identifying the actions that lead to long-term rewards.
Each black circle is some game state and each arrow is a transition
• Take the two games we won and slightly encourage every single action we made in that episode.
• Take the two games we lost and slightly discourage every single action we made in that episode.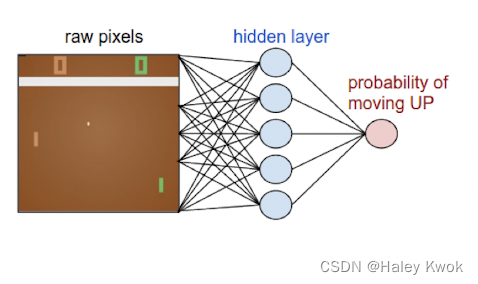
Lecture 6: CHATBOTS AND CONVERSATIONAL AGENTS
Introduction to Chatbots and/or Conversational Agents
- Chatbots: open-domain (or Non-task-oriented) dialogue system • Mimic informal human chatting • For fun, or even for therapy (why?) e.g. Xiaoice from MSRA
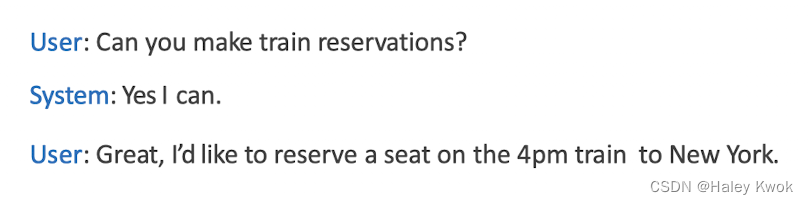
- Task-based (or Task-oriented) Dialogue Agents • Interfaces with personal assistants • For task completion • E.g., Used in cars, robots, appliances • E.g., Used for booking flights or restaurants e.g. Siri from Apple
Properties of Human Conversation
Barge-in (problems with ending) • Allowing the user to interrupt End-pointing (problems with starting) • The task for a speech system of deciding whether the user has stopped talking. • Very hard, since people often pause in the middle of turns
Grounding
Principle of closure. Agents performing an action require evidence, sufficient for current purposes, that they have succeeded in performing it (Clark 1996, after Norman 1988)
- Grounding: acknowledging that the hearer has understood Grounding is relevant for human-machine interaction • Why do elevator buttons light up? To confirm they get the point
- Adjacency pairs: • QUESTION… ANSWER • PROPOSAL… ACCEPTANCE/REJECTION • COMPLIMENTS (“Nice jacket!")… DOWNPLAYER (“Oh, this old thing?”
- Sub-dialogues: interactions where a system question is responded to with a question or request from the user, who thus initiates a subdialogue.
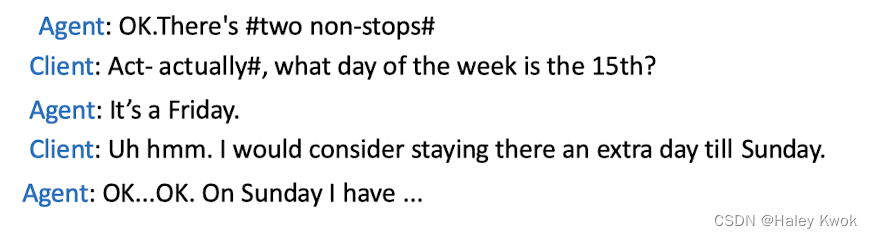
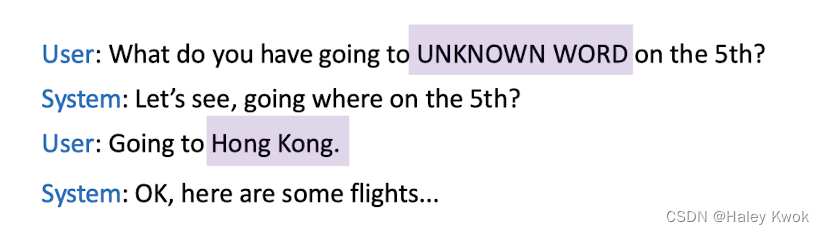
- Clarification:
- Pre-Sequenece of Sub-dialogues:
Problems: Inference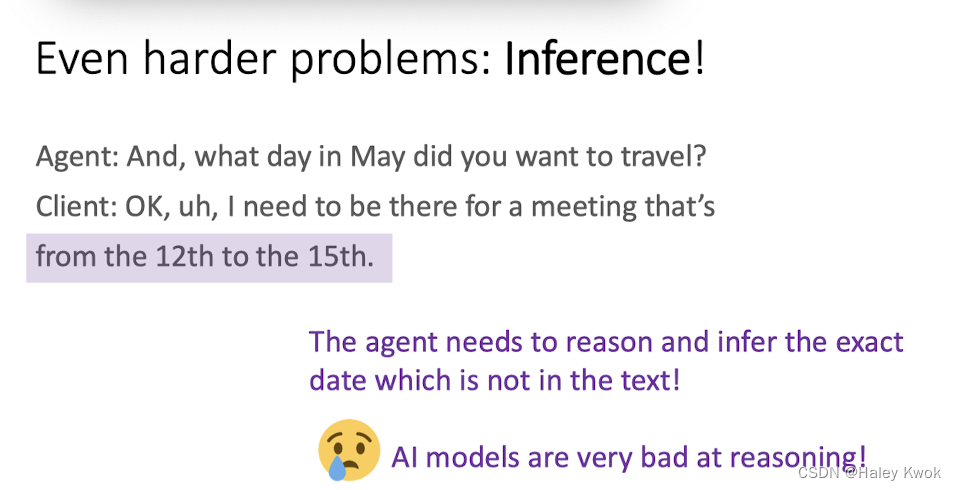
Some conversations are controlled by one person • A reporter interviewing a chef asks questions, and the chef responds. • This reporter has the conversational initiative (Walker and Whittaker 1990)
Most human conversations have mixed initiatives: • I lead, then you lead, then I lead. • Mixed initiative is very hard for NLP systems, which often default to
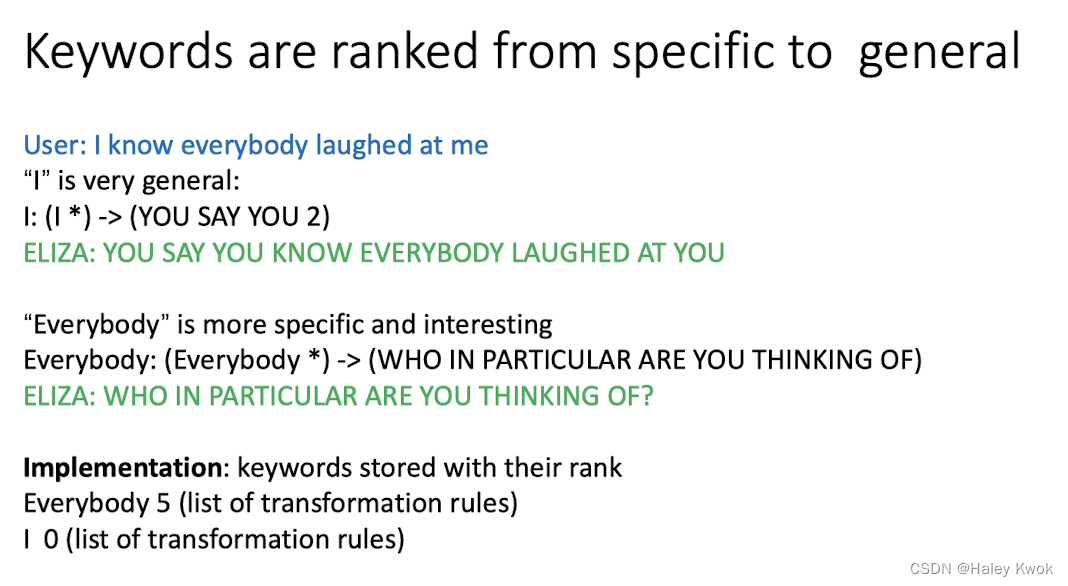
Rule-based Chatbots: ELIZA and PARRY
- Eliza raised some ethical implications because people developed feelings for it.
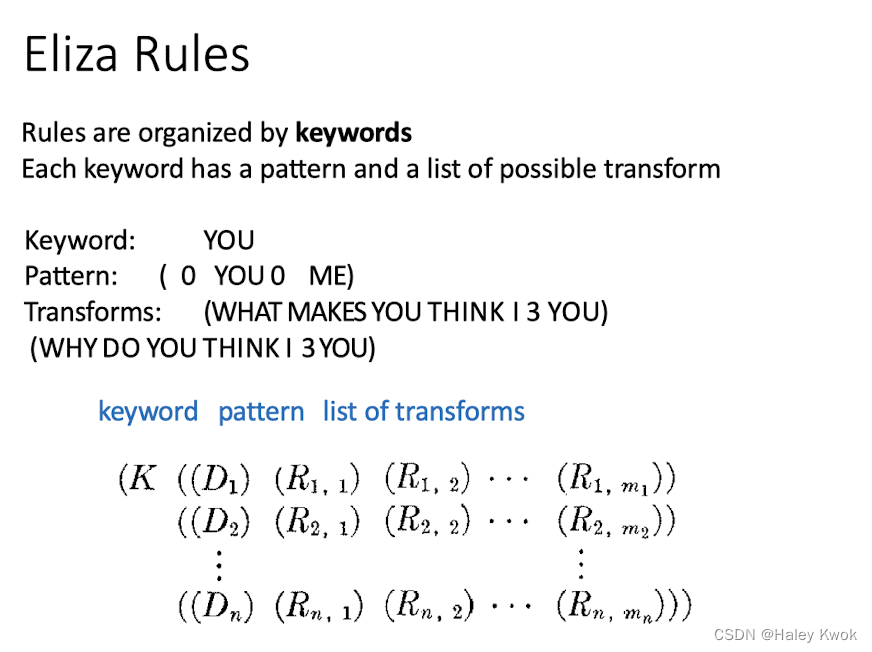
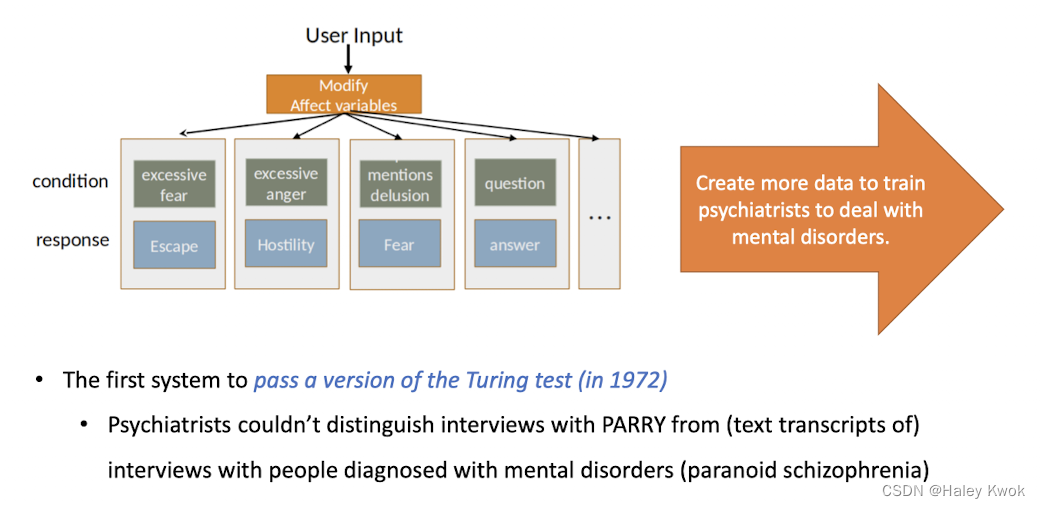
- Parry is designed to study psychology problems (to mimic patients) and is the first system that passed the Turing test in 1972.
Another chatbot with a clinical psychology focus patients usually interpret
Lecture 7: NLP and SENTIMENT ANALYSIS
1. Word Meanings
A sense or “concept” is the meaning component of a word
- Relations between senses: Synonymy
- Similarity
2. Vector Semantics
Suppose you see these sentences: • Ong choi is delicious sautéed with garlic. • Ong choi is superb over rice • Ong choi leaves with salty sauces And you’ve also seen these: • …spinach sautéed with garlic over rice • Chard stems and leaves are delicious • Collard greens and other salty leafy greens Conclusion: • Ong choi is a leafy green like spinach, chard, or collard greens
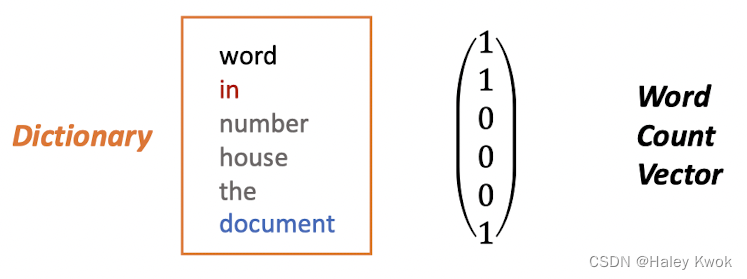
- A word vector is also called an " embedding” because it’s embedded into a high-dimensional space
- The standard way to represent meaning in NLP
A vector is an ordered list of numbers, such as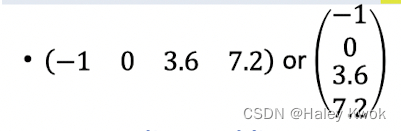
Elements or entries, e.g., the 3rd entry is 3.6 Count of entries, dimension Vectors of dimension n: n-vector Numbers are called scalars
- with words, a feature is a word identity, need the exact same word
- with embeddings, a feature is a word vector, we generalise similar but unseen words
Embeddings example:
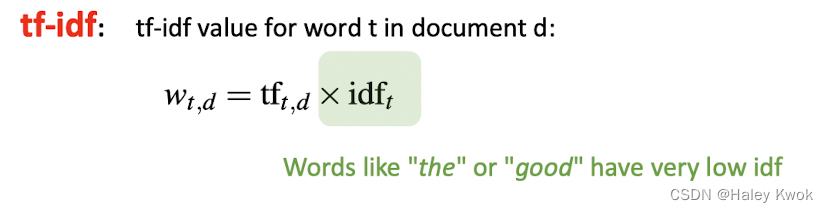
- tf-idf, simple baseline model, sparse vectors, represented by the counts of nearby words
- Word2vec, dense vectors, by creating classifier to predict if a word is likely to appear nearby, where it extensions are called contextual embeddings and it is the ancestor of BERT
3. Word and Vectors
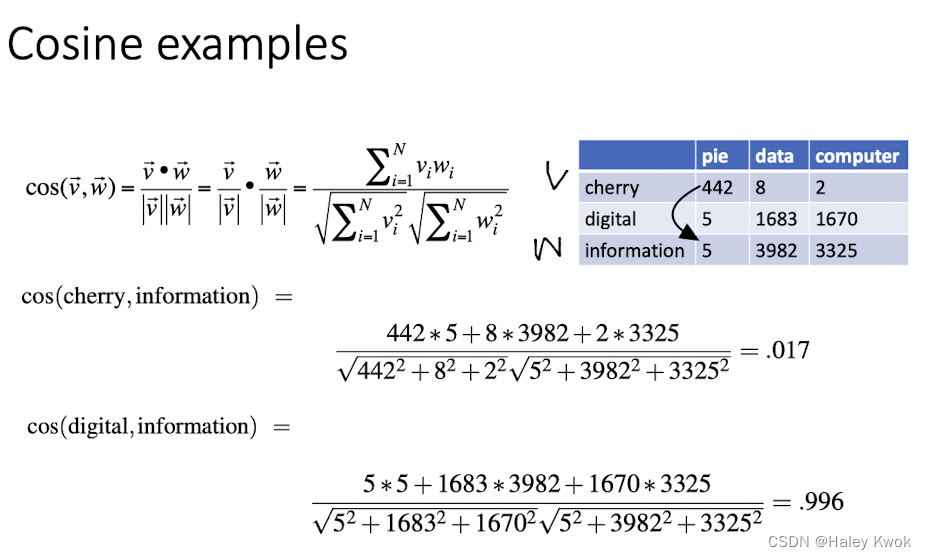
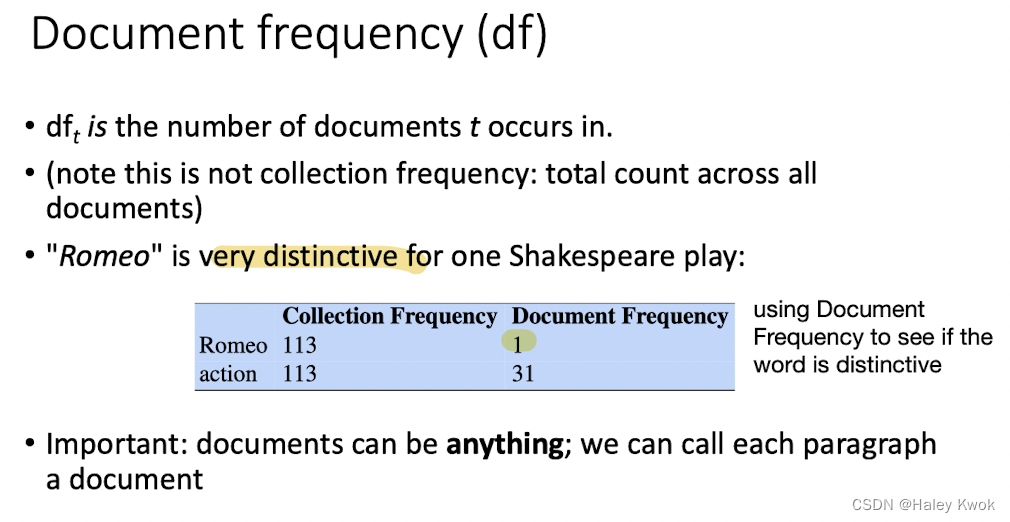
Term-document matrix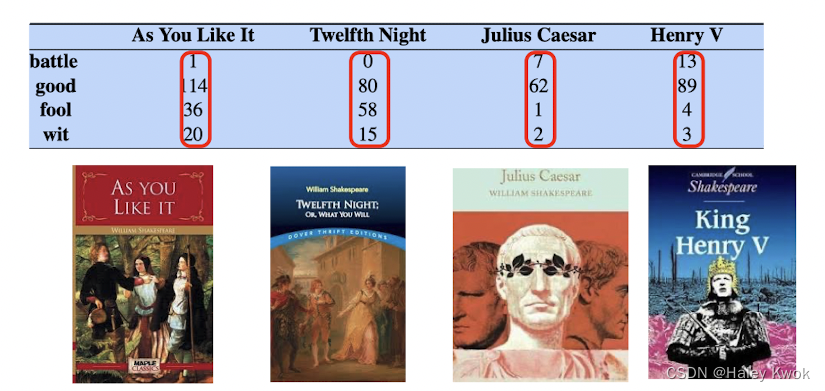
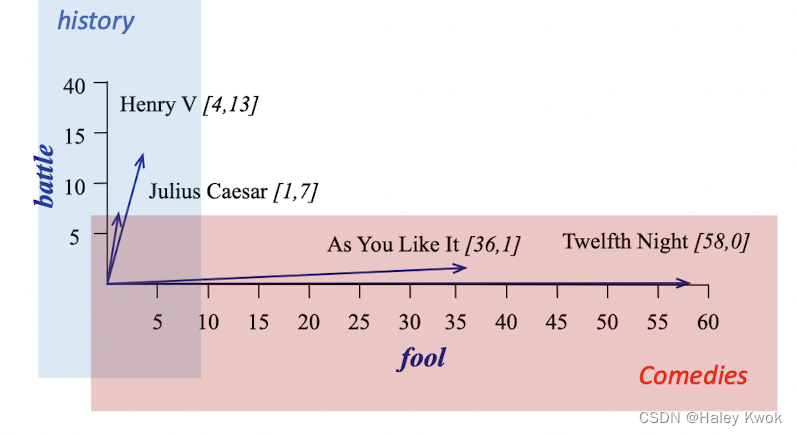
Vectors are the basis of information retrieval (comparing the similarity between documents such as google)
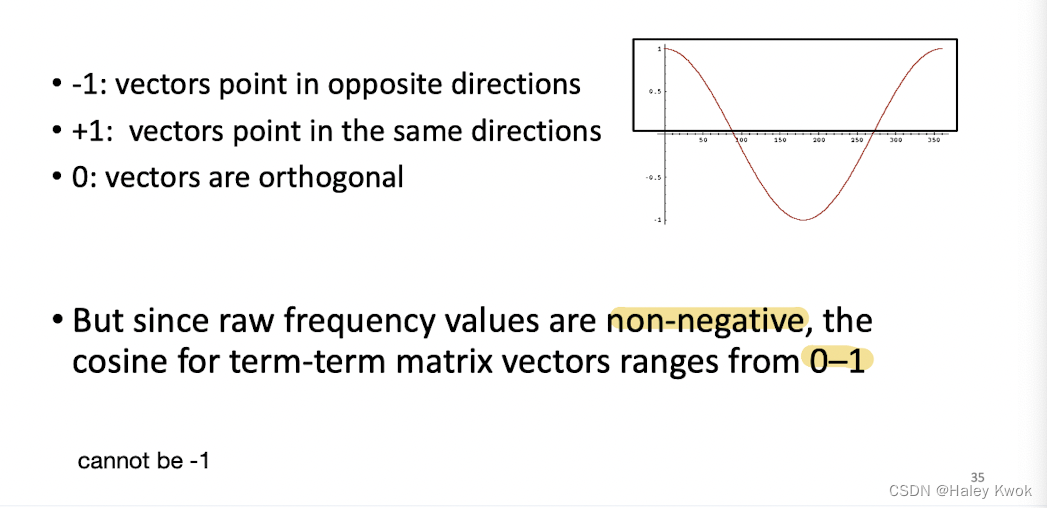
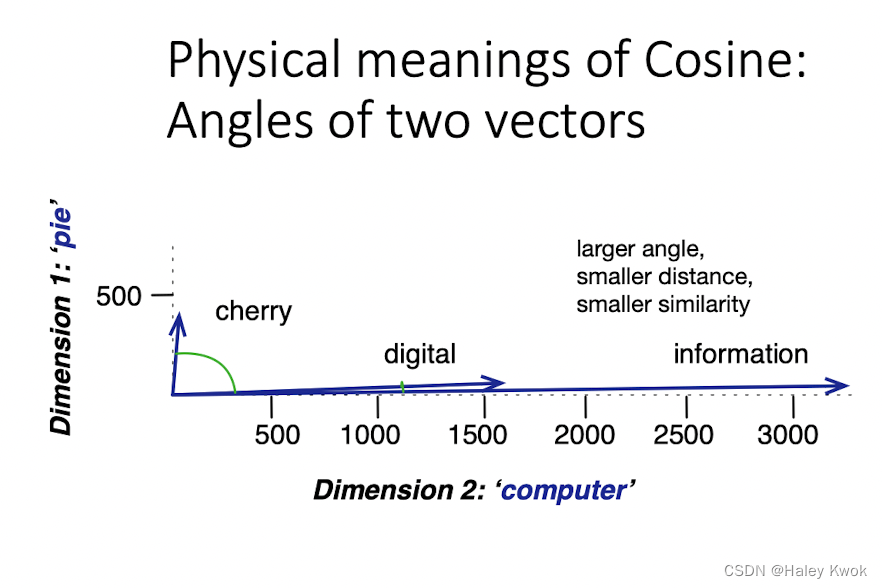
3.1 Cosine Similarity
The dot product between two vectors is a scalar: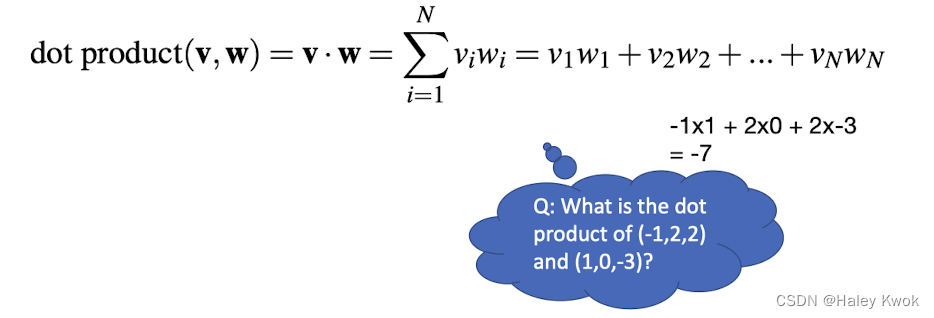
3.2 TF-IDF
4. NLP Applications for Sentiment Analysis
Summary: Text Classification • Sentiment analysis • Spam detection • Authorship identification • Language Identification • Assigning subject categories, topics, or genre
Any kind of classifier • Naïve Bayes • LogisXc regression • Neural networks • k-Nearest Neighbors
4.1 Naive Bayes
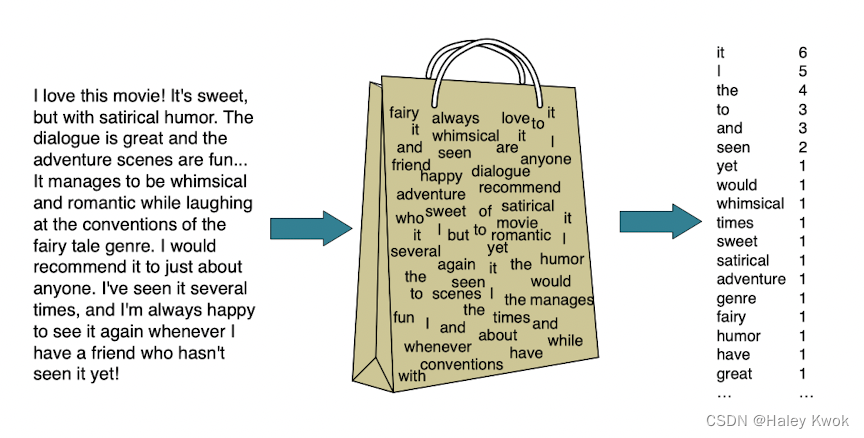
Bag of words (the count of words in a document)
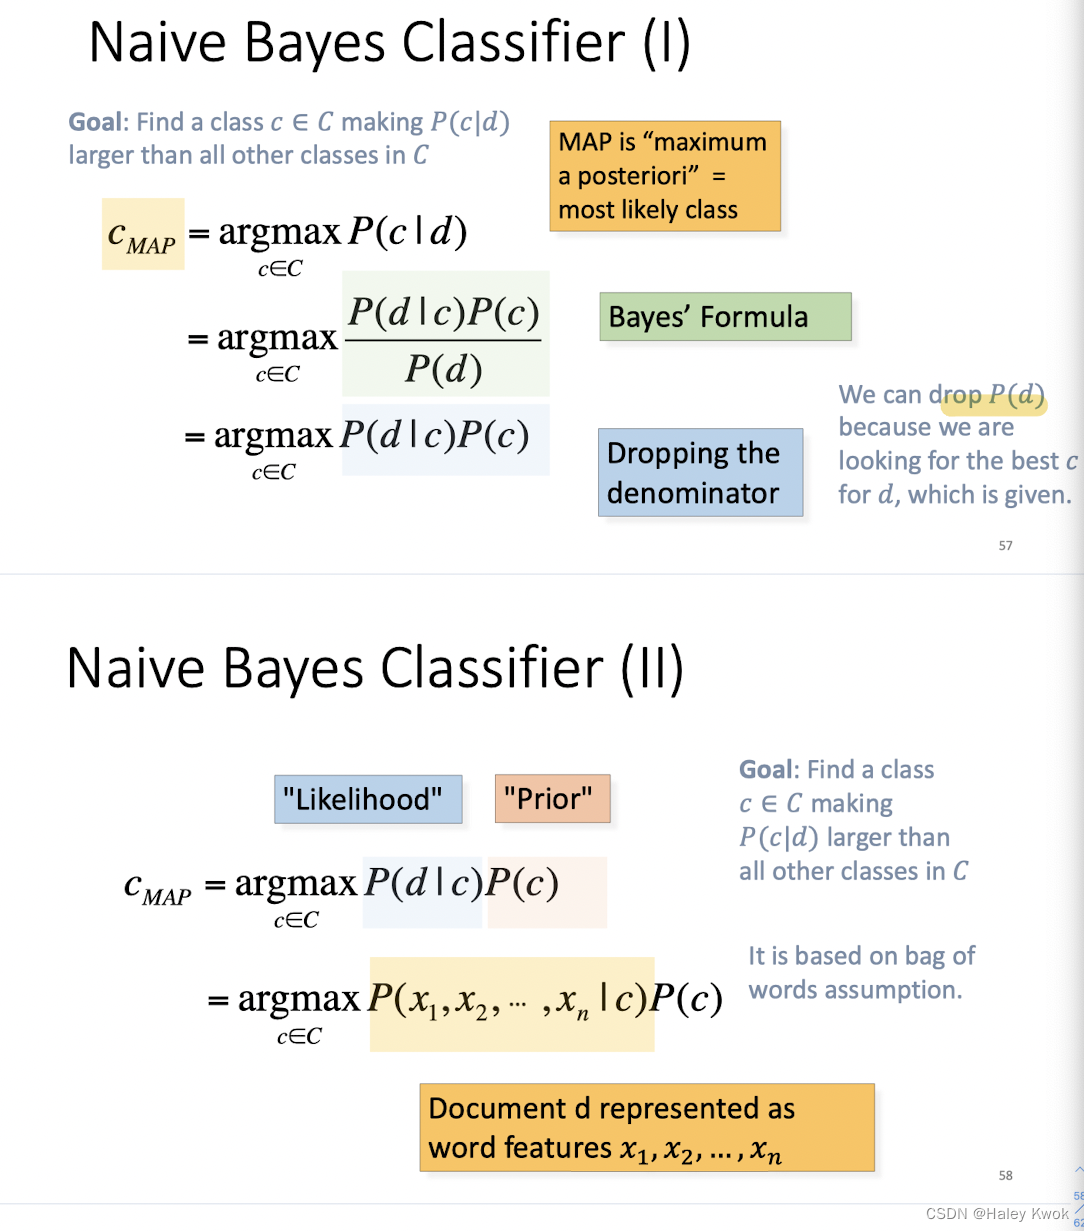
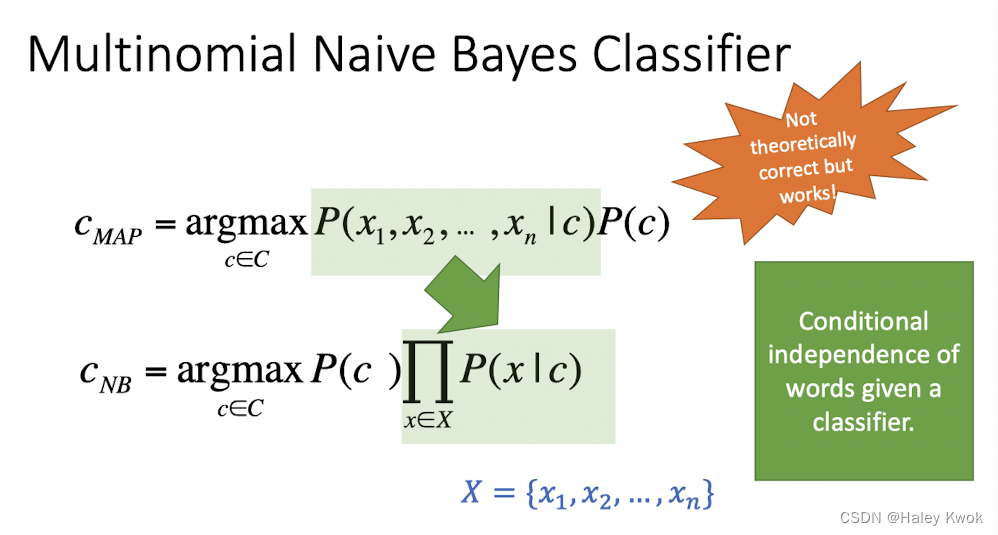
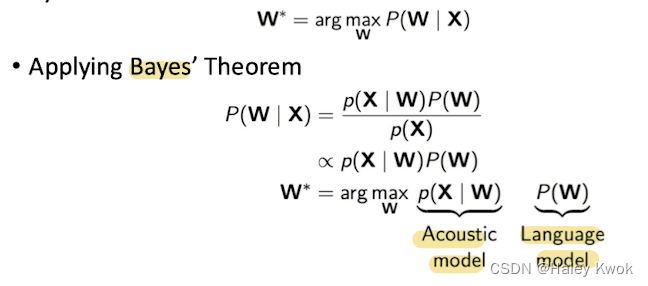
It is based on Bayes’ rules and jointly considers likelihood (probability of observing the words in labeled with the class) and prior (probability of observing a class)
Lecture 8: RECOMMENDATION SYSTEMS
1. Fundamentals
Non-personalized recommendation
• Television • Newspaper
Personalized recommendation
• Motivation 1: diverse needs • Motivation 2: too many choices • Television → Video website • Newspaper → Social media
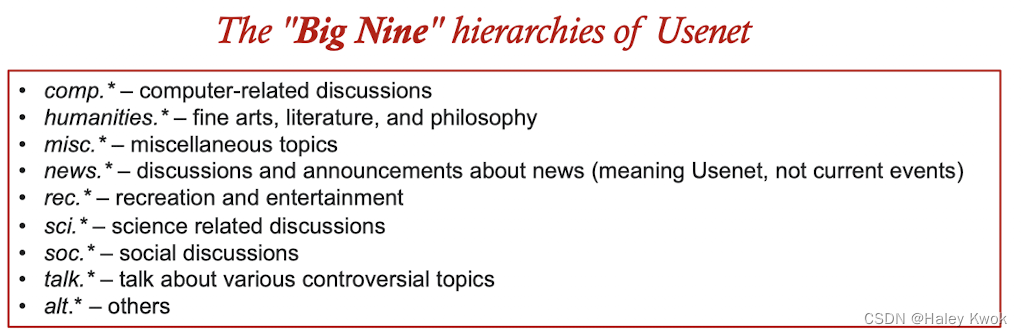
Usenet Communication System
2. Example
Ringo: Social Information Filtering
- Evaluation Criteria: MAE • Mean absolute error (MAE), minimise it.
- Evaluation Criteria: STD • Standard deviation (STD) of the errors, minimise the errors.
Base Case Algorithm: Averages
Baseline method for comparison • For each artist in the target set • The mean score received by an artist in the source set is used as the predicted score for that artist. • A social information filtering algorithm is neither personalized nor accurate unless it is a significant improvement over this base case (by simply averaging all scores) algorithm.
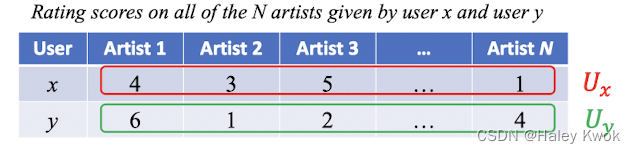
Social information filtering
• Idea: recommendation based on similarity between users • Notation: two users profiles $U_x$ and $U_y$ are N-dimensional vectors (N-vectors):
Algorithm 1: Mean Squared Differences (MSD)
The lower the mean squared difference, the greater the similarity
Algorithm 2: Pearson r
This coefficient ranges from -1 indicating a negative correlation, via 0, indicating no correlation, to +1 indicating a positive correlation between two users.
Algorithm 3: Constrained Pearson r
We modifed the Pearson r scheme so that only when there is an instance where both people have rated an artist positively, above 4, or both negatively, below 4, will the correlation coefficient increase.
Use 4 as the average instead of, since there may be some constraints and considerations
3. Methods
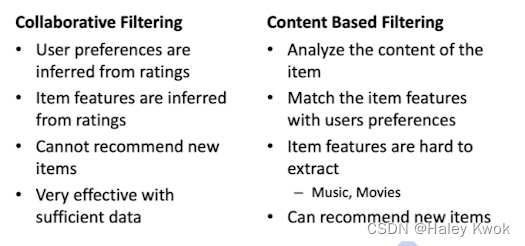
3.1 Content-based Filtering
Explicit feedback
Feature Matrix Demonstration
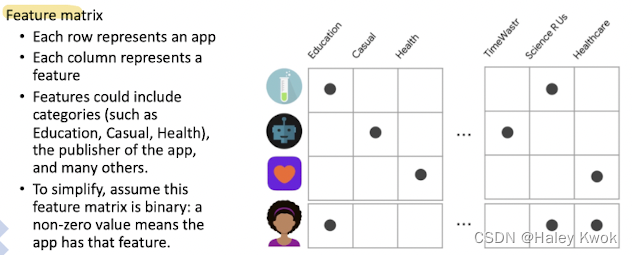
Similarity: dot production in binary case; We assume this feature matrix is binary: a non-zero value (e.g. 1)means the app has that feature.
• In this case dot product is the number of features that are active in both vectors simultaneously. As we will see, most metrics for similarity between vectors are based on the dot product.
For example, a user selects ”Education apps" in their profile. Other features can be implicit, based on the apps they have previously installed. For example, the user installed another app published by Science R Us.
To do so, you must first pick a similarity metric (for example, dot product). Then, you must set up the system to score each candidate item according to this similarity metric.
Pros
• The model doesn’t need any data about other users, since the recommendations are specific to this user. This makes it easier to scale to a large number of users. • The model can capture the specific interests of a user, and can recommend niche items that very few other users are interested in.
Cons
• Since the feature representation of the items are hand-engineered to some extent, this technique requires a lot of domain knowledge. Therefore, the model can only be as good as the hand-engineered features.
• The model can only make recommendations based on existing interests of the user. In other words, the model has limited ability to expand on the users’ existing interests.
3.2 Collaborative Filtering
Preference can ve explicit or implicit
• Collaborative filtering models can recommend an item to user A based on the interests of a similar user B.
• Furthermore, the embeddings can be learned automatically, without relying on hand-engineering of features.
Pros • We don’t need domain knowledge because the embeddings are automatically learned. • The model can help users discover new interests. In isolation, the machine learning system may not know the user is interested in a given item, but the model might still recommend it because similar users are interested in that item. Cons • Cold start problem: cannot handle fresh items
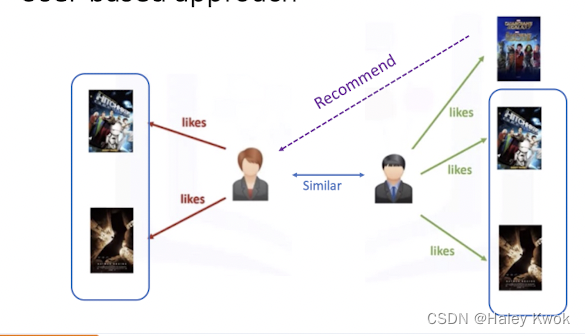
User-based:
• Based on the user similarity or neighborhood
In user-based collaborative filtering, we have an active user for whom the recommendation is aimed. • The collaborative filtering engine first looks for users who are similar. That is users who share the active users rating patterns. • Collaborative filtering basis this similarity on things like history, preference, and choices that users make when buying, watching, or enjoying something. • For instance, if two users are similar or are neighbors in terms of their interested movies, we can recommend a movie to the active user that her neighbor has already seen.
Item-based:
• Based on similarity among items calculated using people’s rating of those items
Comparsion
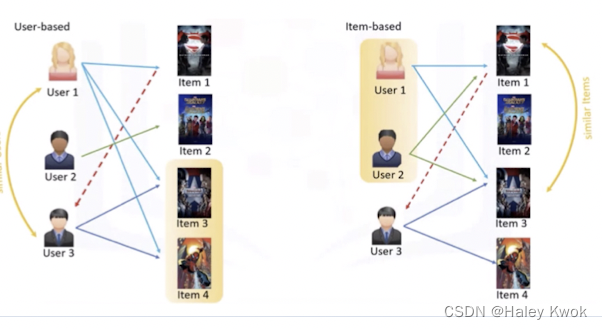
What is the difference between content-based filtering and item-based collaborative filtering? • In the item-based collaborative filtering, similar items build neighborhoods on the behavior of users. • However, it is not based on their contents. • For example, Item 1 and Item 3 are considered neighbors as they were positively rated by both User 1 and User 2. So, Item 1 can be recommended to User 3 as he has already shown interest in Item 3. But all these can be done without knowing the content of items.
4. Applications
Healthcare, news, product, building information, tourism, etc.
Lecture 9: SOCIAL NETWORKS ANALYSIS
Stories behind various Social Networks
Behind each such system there is an intricate wiring diagram, a network, that defines the interactions between the components
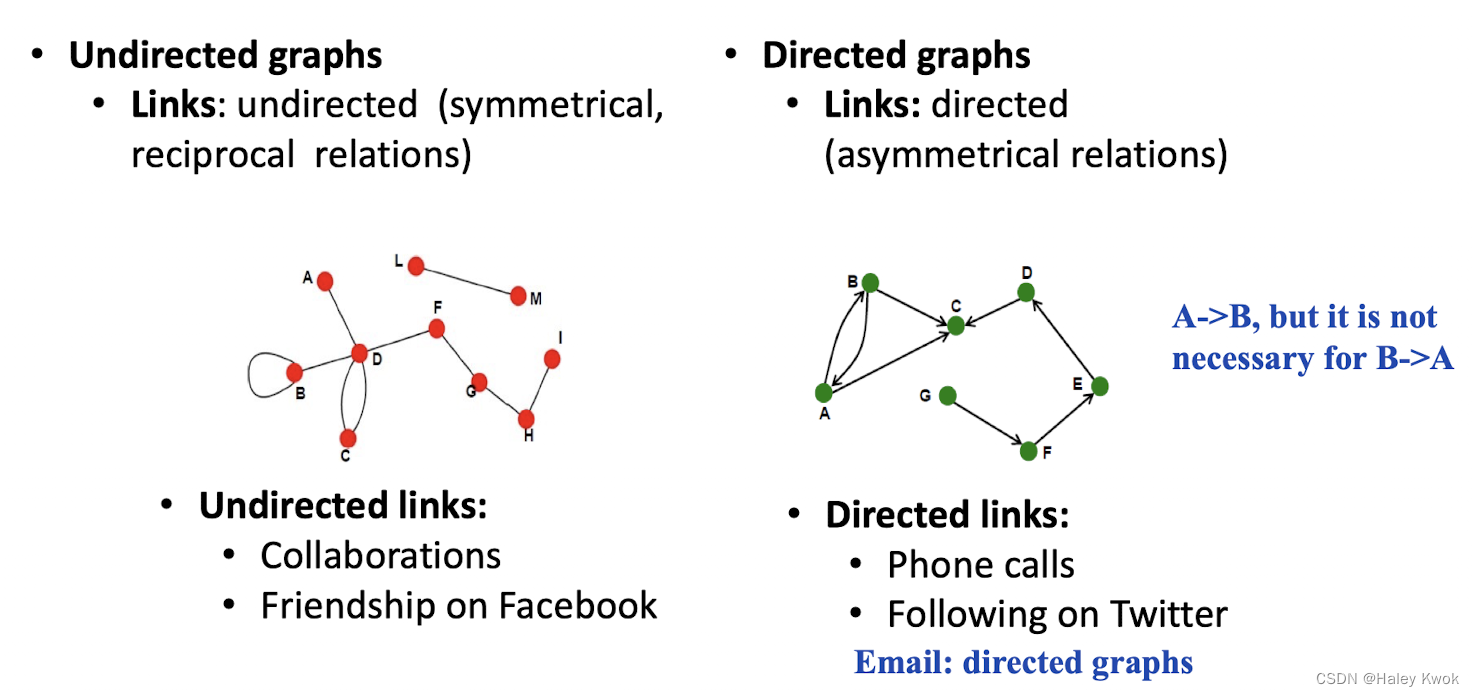
Networks representation with a Graph
Distance (shortest path, geodesic) between a pair of nodes is defined as the number of edges along the shortest path connecting the nodes • If the two nodes are disconnected, the distance is usually defined as infinite • In directed graphs paths need to follow the direction of the arrows • Consequence: Distance is not symmetric, e.g., $h_{A,C} ≠ h_{C,A}$
Adjacency Matrix
ROW, COLUMN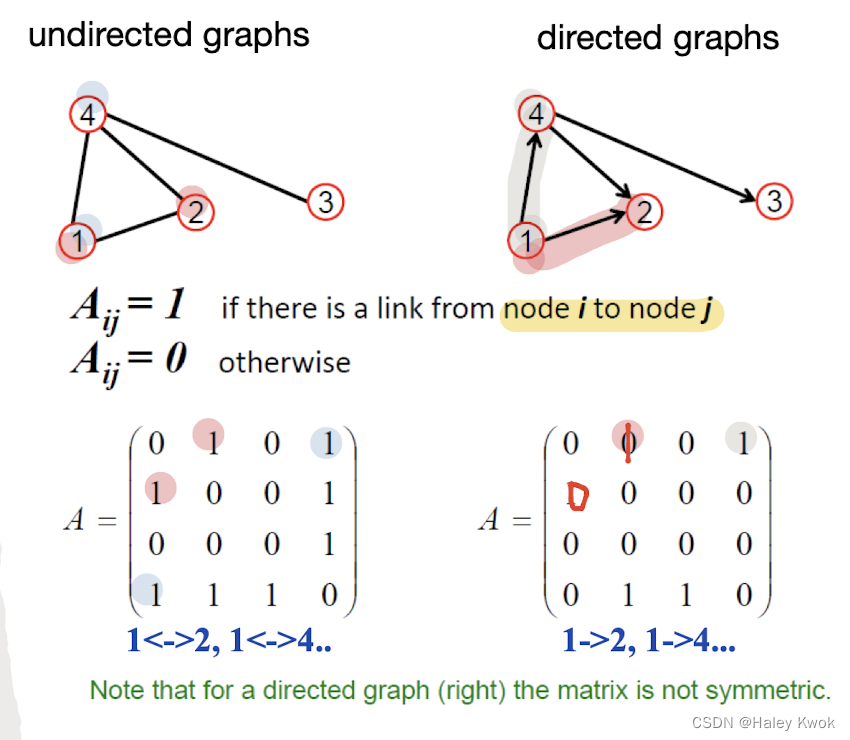
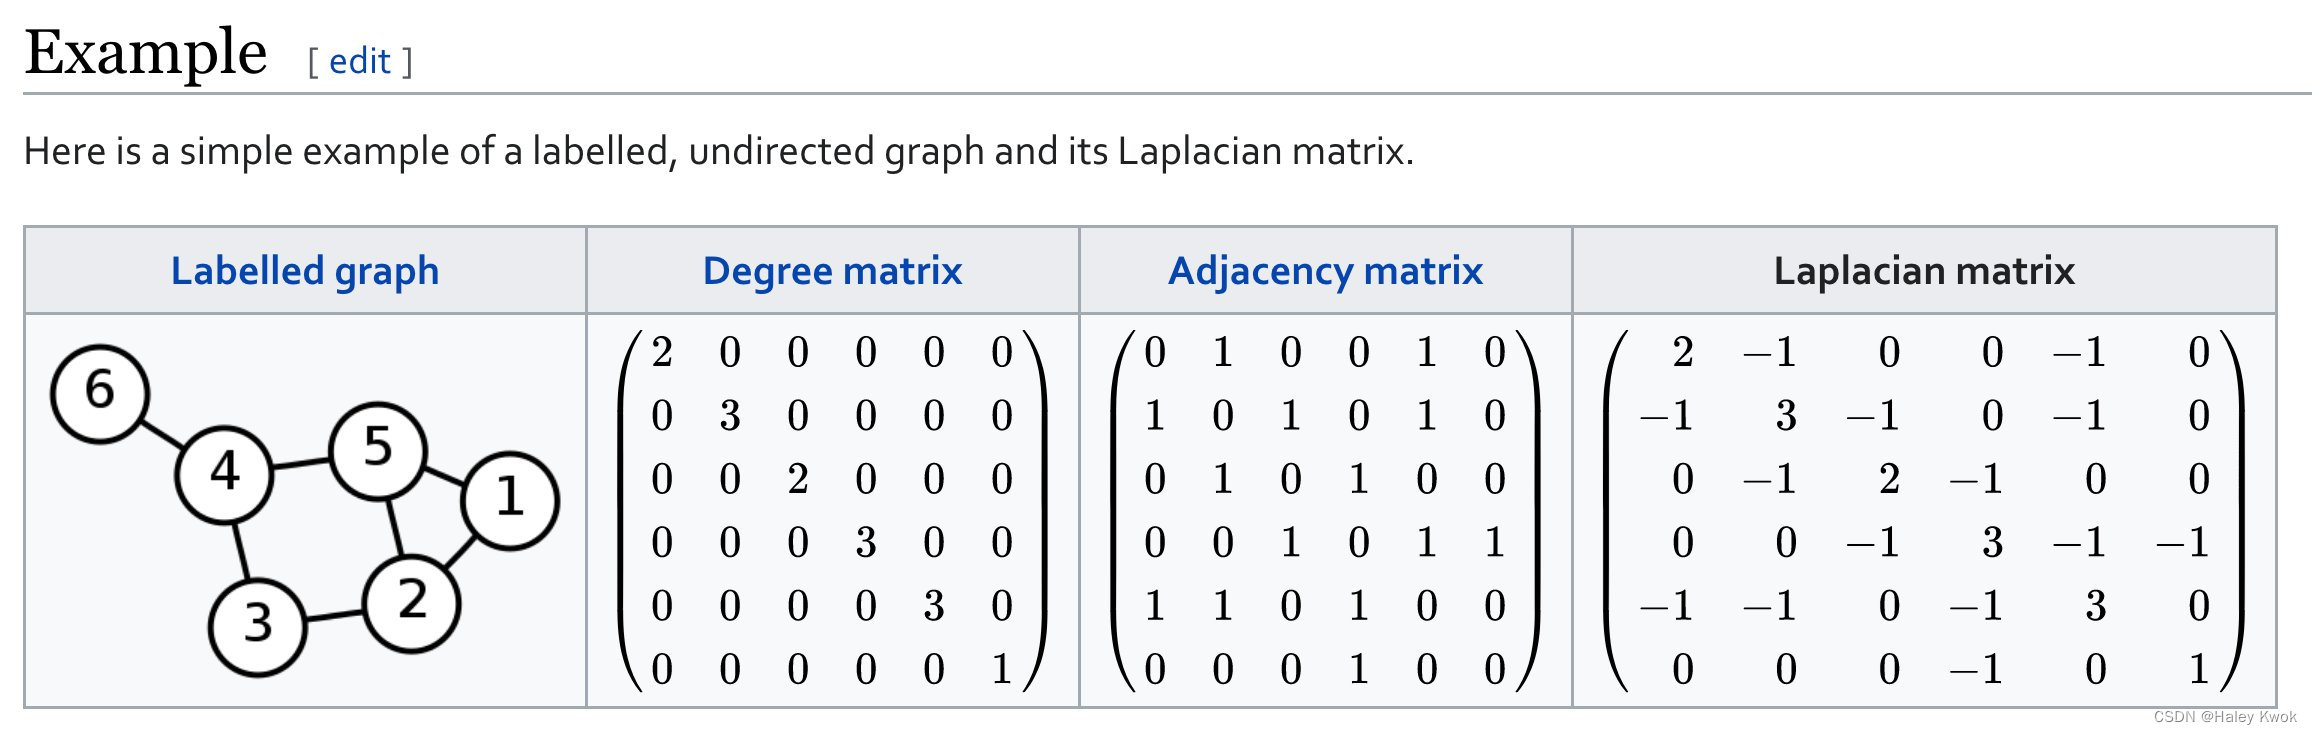
Degree Matrix
Exercise
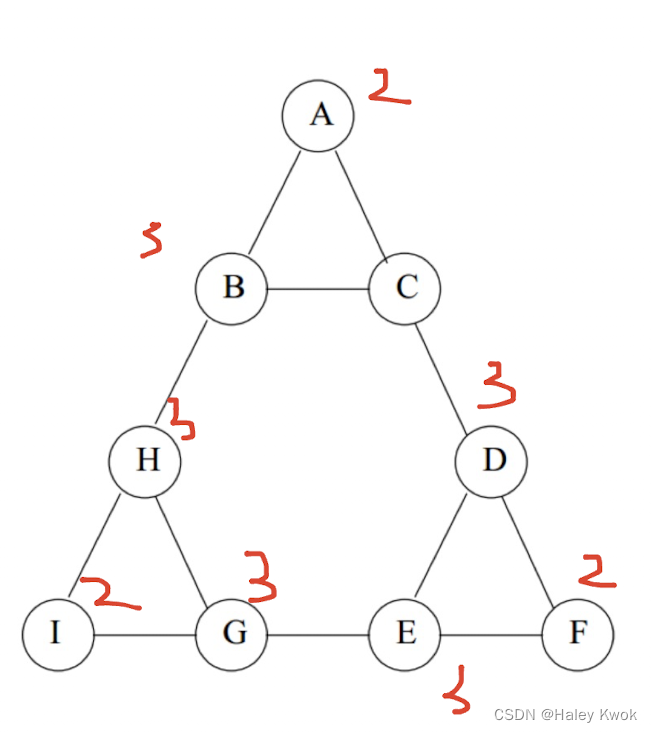
A->B; A->C, so B AND C got 1
A B C D E F G H B C D E F G H
$$ \begin{bmatrix} 0 & 1 & 1 & 0 & 0 & 0 & 0 & 0 & 0 & 0 \ 1 & 0 & 1 & 0 & 0 & 0 & 0 & 1 & 0 & 0 \ 1 & 1 & 0 & 1 & 0 & 0 & 0 & 0 & 0 & 0 \ 0 & 0 & 1 & 0 & 1 & 1 & 0 & 0 & 0 & 0 \ 0 & 0 & 0 & 1 & 1 & 1 & 0 & 0 & 0 & 0 \ 0 & 0 & 0 & 1 & 1 & 0 & 0 & 0 & 0 & 0 \ 0 & 0 & 0 & 0 & 1 & 0 & 0 & 1 & 1 & 0 \ 0 & 1 & 0 & 0 & 0 & 0 & 1 & 0 & 1 & 0 \end{bmatrix} $$
Case Study: Analysis of a real social network
MSN: Degree Distribution
MSN: Log-Log Degree Distribution
Key Properties: Degree distribution: heavily skewed, avg degree = 14.4, Path length:6.6
Most of the path lengths are small
Social Network Analysis Examples
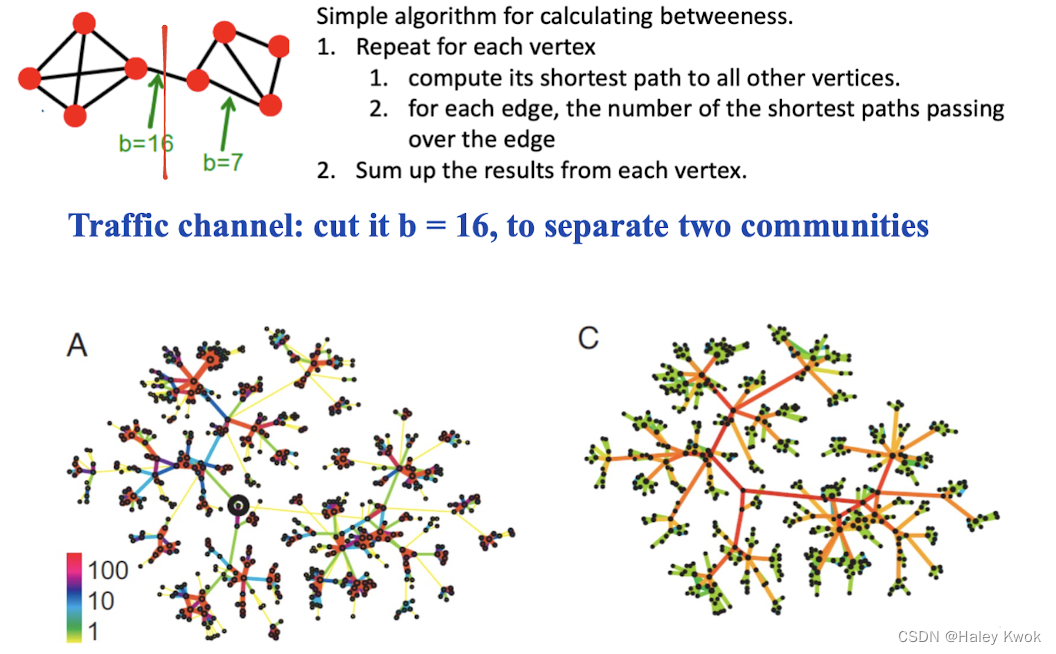
Community Detection
A community is a group of nodes with greater ties internally than to the rest of the network Strictest: Clique
A clique is a subset of vertices of an undirected graph such that every two distinct vertices in the clique are adjacent.
For example, ABC, EDF, HGI
Edge betweenness: number of shortest paths (among all pair od vertices) passing over the edge.
‘Small-world’ phenomenon
The small-world experiment comprised several experiments conducted by Stanley Milgram and other researchers examining the average path length for social networks of people in the United States. The research was groundbreaking in that it suggested that human society is a small-world-type network characterized by short path-lengths. The experiments are often associated with the phrase “six degrees of separation”, although Milgram did not use this term himself.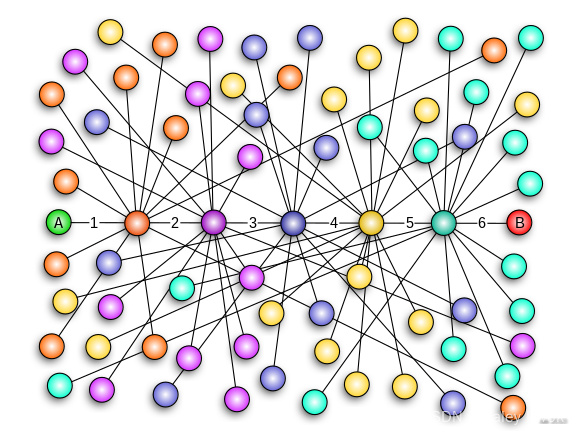

‘Power-law’ degree distributionial Network Analysis
The degree distributions of most real-life networks follow a power law, become straight line
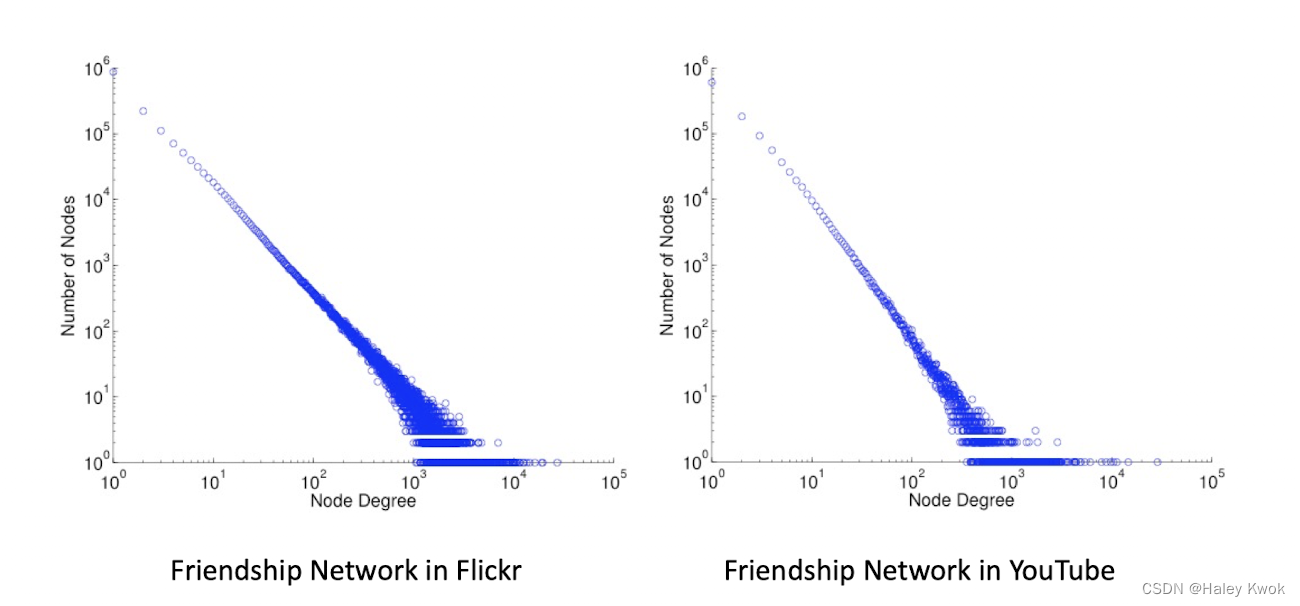
Degree distribution: high skewed
In statistics, a power law is a functional relationship between two quantities, where a relative change in one quantity results in a proportional relative change in the other quantity, independent of the initial size of those quantities: one quantity varies as a power of another. for instance, considering the area of a square in terms of the length of its side, if the length is doubled, the area is multiplied by a factor of four.
Many events of interest to scientists in natural and social life tend to have a typical scale, and the scale of individuals varies little around this characteristic scale. For example, the height of human beings, the vast majority of adult Chinese men are around the average height of 1.70m. Of course, this value varies somewhat by region, but in any case, we have never seen a “dwarf” less than 10cm tall or a “giant” taller than 10m in the street. If we take the height as the horizontal coordinate, the number or probability of obtaining this height as the vertical coordinate, we can draw a bell-shaped distribution curve, which decays very quickly on both sides of the curve; similar to this to a mean can characterize the entire group characteristics of the distribution, we call Poisson distribution.
Social Network • media = content of twitter, tag, videos, photos …. • The networks formed by individuals • Social Media • social network + media
Lecture 10: SOCIETAL IMPLICATIONS OF AIDA
The positive values of AIDA practice
Input and output of AIDA are multidisciplinary
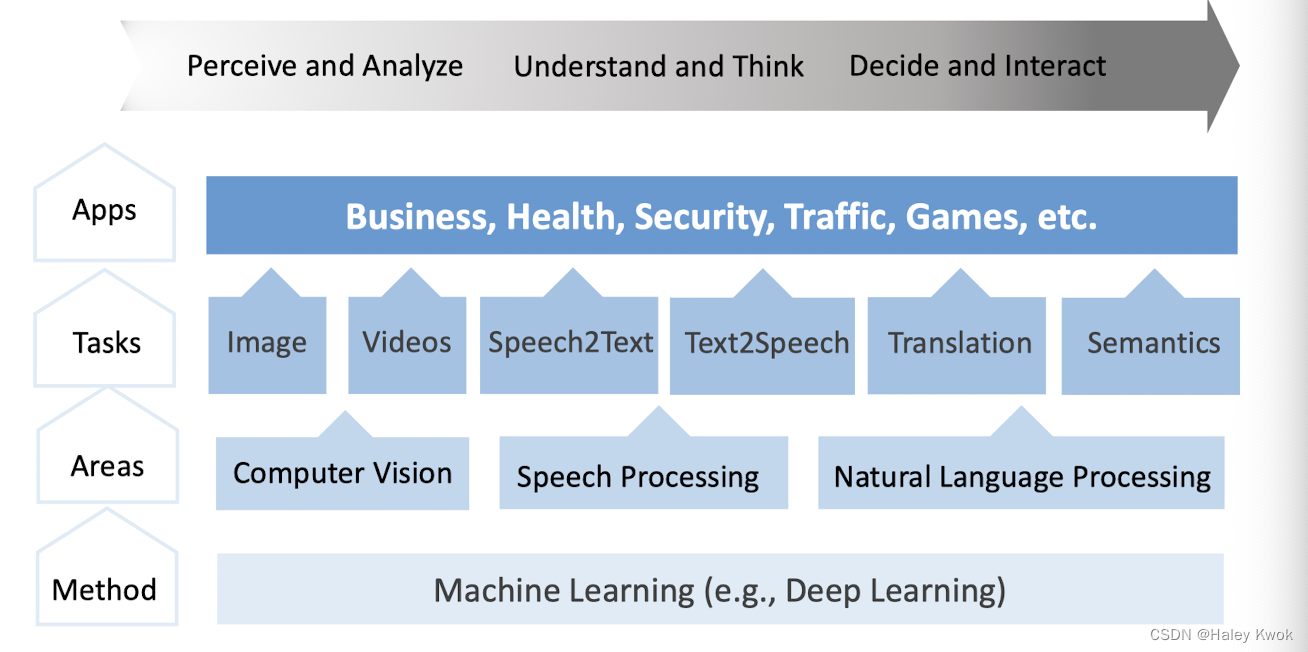
NLP: Read and write Speech Processing: Listen and speak CV: See
Impacts:
- Advance our society’s efficiency and effectiveness toward scientific governance and intelligent decision-making.
- Optimize the processes and methods of production, and free people from part of the productive labour.
- Give human individuals hands-on assistance and revolutionize our everyday life for a better living.
Drone: Learn policy form user demonstrations with RL
The concerns about AIDA’s societal implications
Ethics change with technological progress Industrial Revolution -> Right to Internet access -> Birth control, surrogate pregnancy, embryo selection, artificial womb -> Lab-grown meat
Privacy and Data Ownership
Data privacy is the claim of individuals, groups and institutions to determine for themselves, when, how, and to what extent information about them is communicated to others.
Three dimensions of Data Privacy
• Personal privacy . Protecting a person against undue interference (such as physical searches) and information that violates his/her moral sense. • Territorial privacy. Protecting a physical area surrounding a person may not be violated without the person’s acquiescence. • Safeguards : laws referring to trespassers’ search warrants. • Informational privacy. Deals with the gathering, compilation, and selective dissemination of information
Privacy concerns in data use
• Data Collection e.g., fingerprints, health data, etc. • Data Storage and Transportation Online data may be accessible to anyone. • Data Analytics. Personal data is used for analysis, e.g., recommender systems.
Solution
- Privacy and data protection laws promoted by government
- Self-regulation for fair information practices by codes of conducts promoted by businesses
- Privacy-enhancing technologies (PETs) adopted by individuals
- Privacy education of consumers and IT professionals
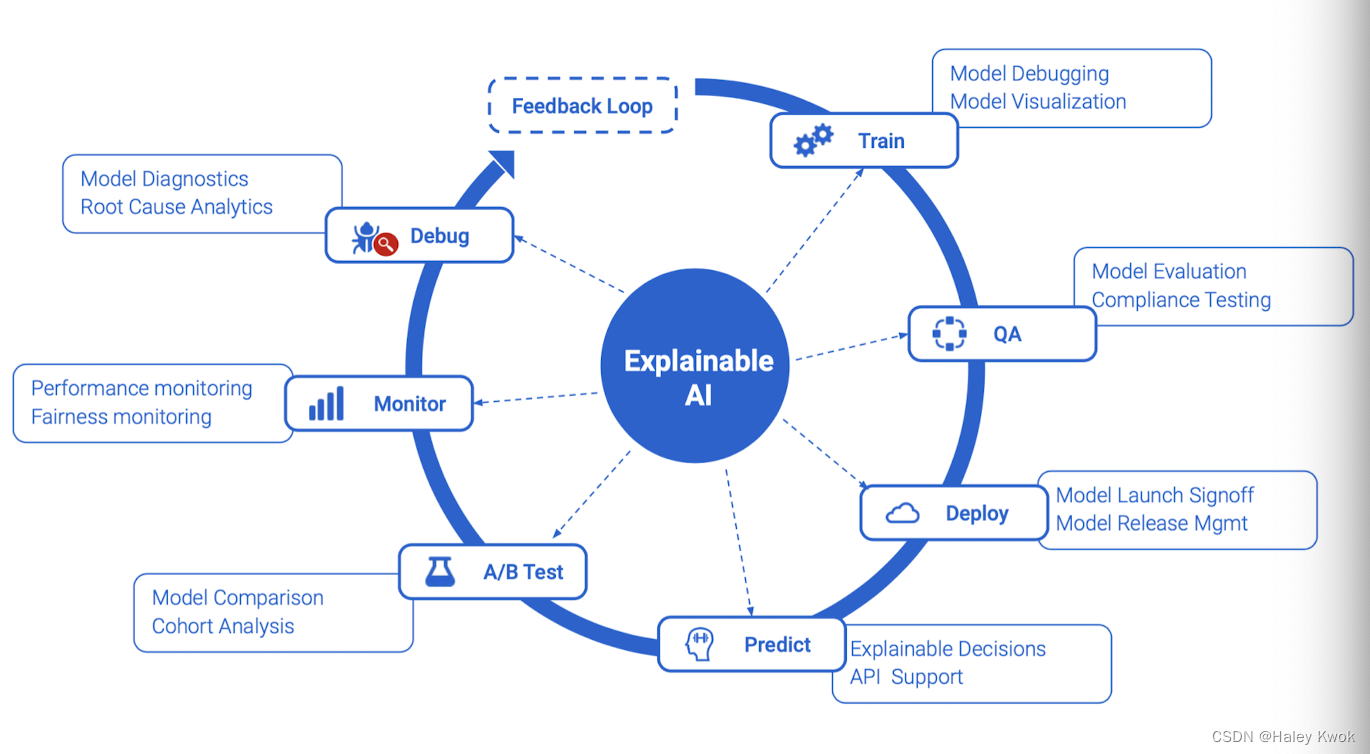
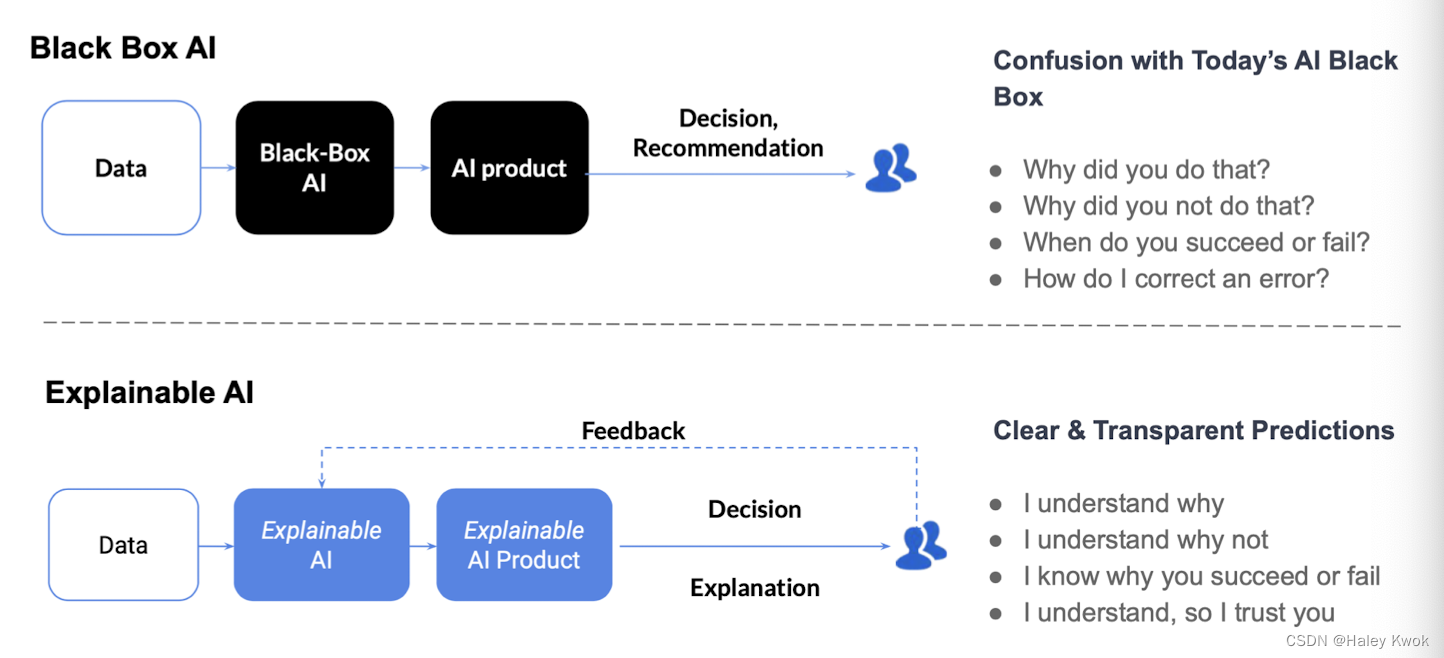
Transparency and Explainable AI
Blackbox: Deep learning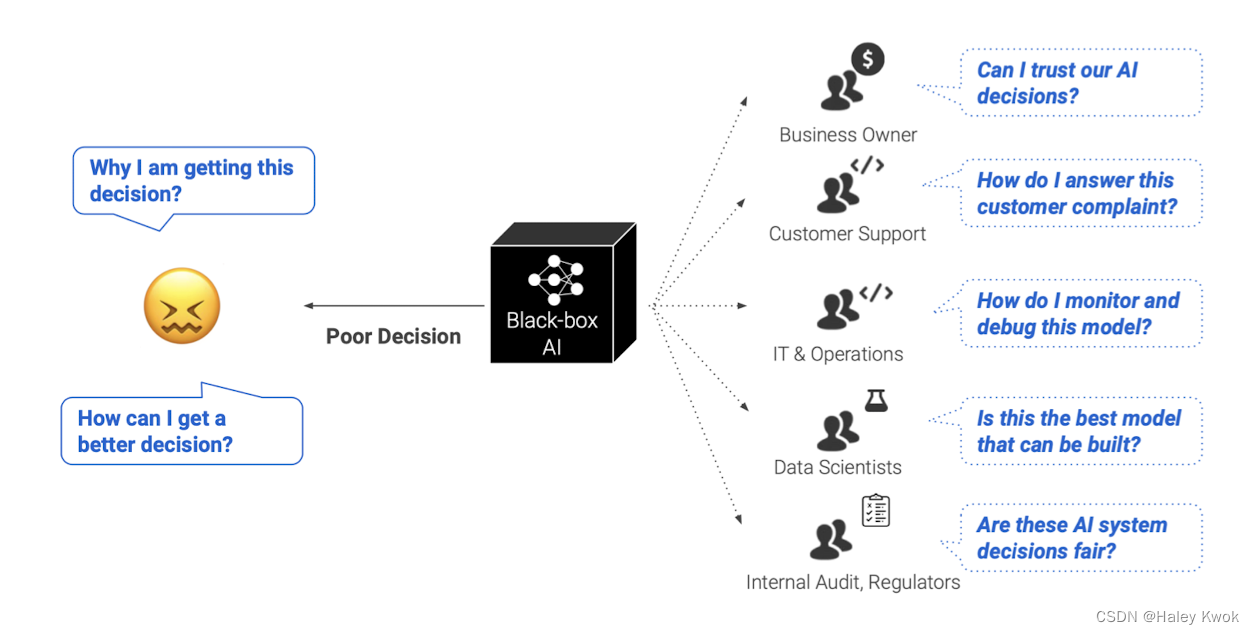
Trustworthiness and Accountability
• National Safety (e.g., Defense construction, infrastructure, and classified systems) • Social Safety (e.g., unemployment) • Network Safety (e.g., illegal data access) • Personal Safety (e.g., accidents caused by mechanical failure)
Replacing human labor Interesting spinL AI controlling human labour
Bias, Equity, and Fairness
Hiring Problems: against women since the annotated data
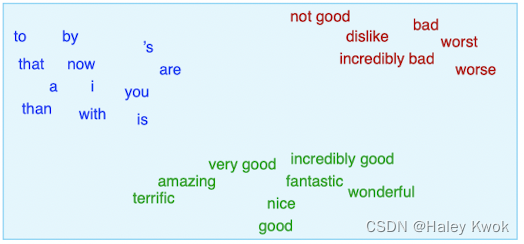
Word Embeddings Word2Vec introduced vector math on word embeddings • Reveal harmful biases encoded in our language corpora • Potential solution: de-bias at training time, but at least make users aware
Solutions
- Support in fairness-aware data collection and curation
- Overcoming teams’ blind spots
- Auditing complex ML systems
- Deciding how to address particular instances of unfairness
- Addressing bites in the humans embedded throughout the ML development pipeline
Lecture 11: COMPUTER VISION AND SPEECH PROCESSING
1. Computer Vision
Make computers understand visual content (e.g., images and video). Vision is an amazing feat of natural intelligence • Visual cortex occupies about 50% of the Macaque brain • More human brain devoted to vision than anything else
1.1 Fundamentals
In 1966, Marvin Minsk • 1966: Minsky assigns computer vision as an undergrad summer project • 1960’s: interpretation of synthetic worlds • 1970’s: some progress in interpreting selected images • 1980’s: artificial neural networks (ANNs) come and go; shift toward geometry and increased mathematical rigor • 1990’s: face recognition; statistical analysis in vogue • 2000’s: broader recognition; large annotated datasets available; video processing starts • 2010’s to present: deep learning
1.2 Representation and learning model
Images consist of pixels • The smallest discrete component of an image on the screen Image resolution • The number of pixels in a digital image Standard images • Illustrate algorithms and compare the performance • Lena: for gray‐level images generally 256*256
- 8‐bit gray‐level image
- Each pixel has a gray value between 0 and 255
• Baboon: for color images generally 512*512
- Red, green and blue 24 bits
- When two light beams impinge on a target, their colors add
Important learning model in CV: CNN
Convolutional neural networks (CNNs) • Promoted the development of deep learning
1.3 Essential Tasks
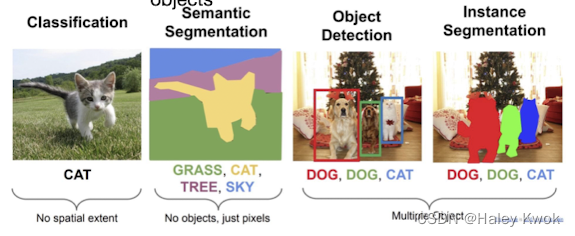
- Image classification
- No spatial extent
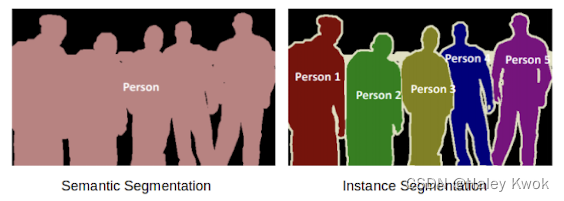
- Semantic Segmentation
- No objects, just pixels
- Object detection/ Instance segmentation
- Multiple object
Associating one label to a given image: single-label classification
- Binary Classification: one out of two
- Multiclass Classification: one out of several things
Associating multiple labels to a given image: multi-label classification
- Multilabel Classification: more than one choice out of several things
pre-training a neural network refers to first training a model on one task or dataset. Then using the parameters or model from this training to train another model on a different task or dataset. This gives the model a head-start instead of starting from scratch
1.4 Object Detection
• Object detection is the field of computer vision that deals with the localization and classification of objects contained in an image or video. • Object detection comes down to drawing bounding boxes around detected objects which allow us to locate them in a given scene (or how they move through it).
- creates a bounding box around the classified object.
• Single-stage object detectors • e.g., YOLO (You Only Look Once): uses a single neural network trained end to end to take in a photograph as input and predicts bounding boxes and class labels directly • Two-stage object detectors • First extract ROIs (Region of interest), then classify and regress the ROIs • e.g., R-CNN, Fast-RCNN, Faster-RCNN, Mask-RCNN
1.5 Image segmentation
Image segmentation is a sub-domain of computer vision and digital image processing which aims at grouping similar regions or segments of an image under their respective class labels.
Semantic segmentation
• Refers to the classification of pixels in an image into semantic classes • Pixels belonging to a particular class are classified to that class with no other information or context considered.
Instance segmentation
• Models classify pixels based on “instances” rather than classes
Panoptic segmentation
The combination of semantic segmentation and instance segmentation
2. Speech Processing
Fundamentals
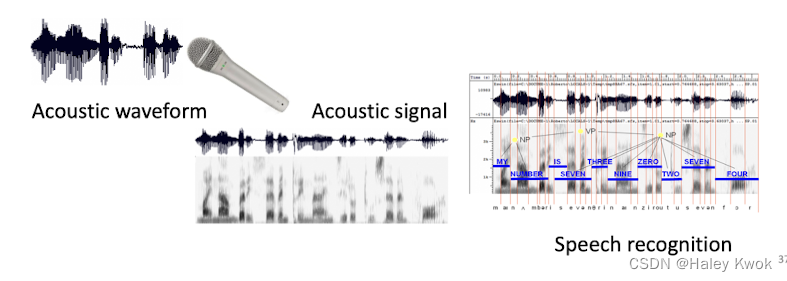
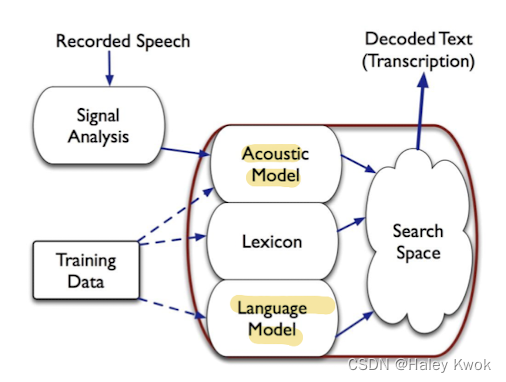
• Speech Recognition: enabling a computer to understand spoken language and convert speech signals into text (speech-to-text transcription)
• Speech Synthesis: enabling a computer to generate spoken language and generate speech signals from the text (text-to-speech transcription)
in voice assistants, the paradigm steps come as speech recognition (speech-to-text translation) → natural language understanding → natural language generation → speech synthesis (text-to-speech translation).
Articulation produces sound waves which the ear conveys to the brain for processing.
What do computer do?
• Digitization • Acoustic analysis of the speech signal • Linguistic interpretation
Difficulties
• Digitization Converting analogue signals into a digital representation • Signal processing • Separating speech from background noise distinctions (similar phonemes) • Phonetics Variability in human speech • Phonology Recognizing individual sound • Lexicology and syntax Disambiguating homophones Features of continuous speech • Syntax and pragmatics Interpreting prosodic features • Pragmatics Filtering of performance errors (disfluencies)
Feature selection
- Sound wave
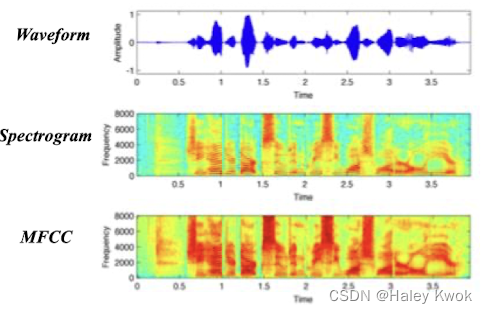
- Speech signals • Waveform • Time • Amplitude
- Spectrogram • Time • Frequency • Power (e.g. marked by color)
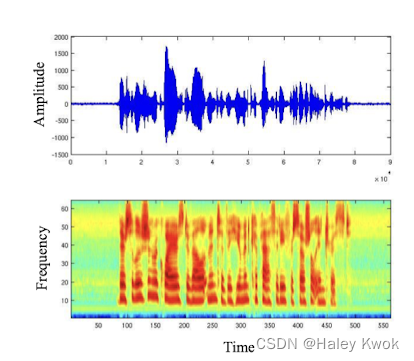
- Cepstral features have been found to perform well • Spectrogram → Spectral → Cepstral • They represent the frequency of the frequencies • Mel-frequency cepstral coefficients (MFCC) are the most common variety
Learning model
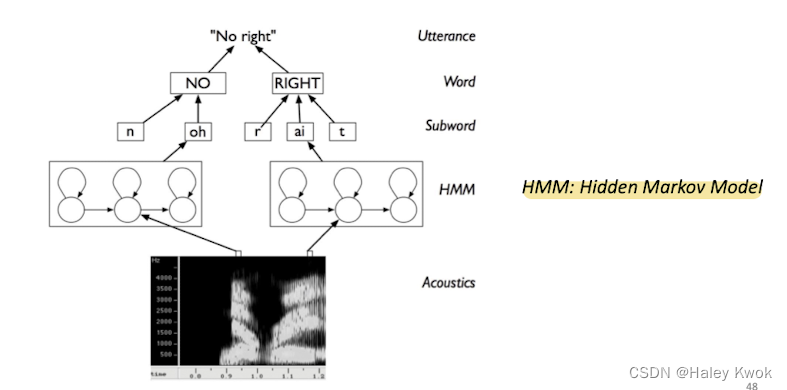
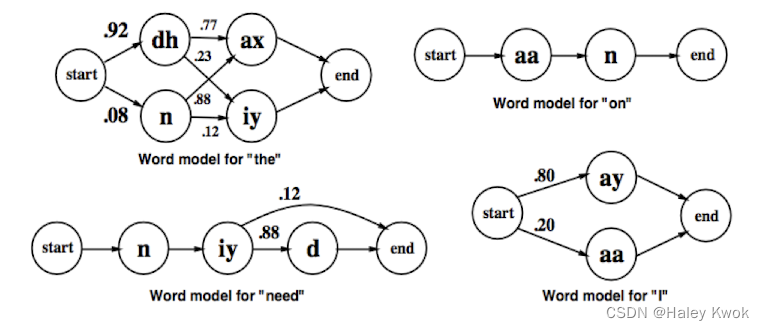
Hidden Markov Chains (HMM) modeling syllable orders
Summary
• Computer Vision (CV) is for “seeing” the world (like our eyes), and Speech Processing (SP) is for “hearing” and “speaking” (like our ears and mouth). Both CV and SP can be based on machine learning and, recently, deep learning. • CV takes visual signals as input (e.g., images), usually represented as pixels accordingly to the resolution and colors. • Several essential CV tasks, such as image classification, object detection, and semantic/instance segmentation (what are they?) • SP involves speech recognition (speech2text) and speech synthesis (text2speech). Its input is speech signals (sound waves)
Hin Chi Kwok
Student in ISE and Computing
I strongly believe that the 3Cs - CURIOSITY, CHALLENGE, and CHANGE - will shape my future, help me achieve my goals, and positively impact my community. I am passionate for technology, and I am here to share my journey of rediscovering my passion for STEM. Despite facing gender stereotypes and societal expectations from selecting IT as my career before, I pursue my CURIOSITY and participate in research projects and competitions. I embrace CHALLENGES, seek innovative solutions, and am actively involved in academic exchanges and entrepreneurship. My ultimate ambition is to translate my research into real products, contribute to make CHANGES in the science and technology industry, and inspire others to pursue a career in STEM.